We've come to the point where we're ready to start generating things from the character's point of view. The movement of air masses sounds very interesting to us, but none of that can be seen or understood by the character, so in the long run this is just a way to describe the data we're using, so that when we decide to muck about with that data later, we know what generated what.
We've managed to create some very interesting effects with very little data. It's time to take this foundation and throw a few dice - or rather, to have excel produce some random numbers. I'm sorry, this system simply isn't designed to satisfy the mechanic of using dice. Dice, I would have to argue, would severely retard the elegance of the system; I'm not prepared to break the system just so it can submit to the use of a 16th century technology.
Learn how to use excel.
Step 5: Conditions
We have eight varieties of 'Conditions,' as introduced in the last post: sunny (HH), overcast (LL), thunderhead (HL), wind storm (LH), rain clouds (HM), light clouds (MH), condensation (LM) and clear (ML & MM).
Weather forecasters use the terms clear, sunny and fair interchangeably, so the differences tend to depend upon the meteorologist's personal perception. Here's a good description of the real world difference from the Chicago Tribune.
I said at the beginning, however, that the real world could go hang. For this system, the difference is a question of light refraction. Both conditions lack clouds. 'Clear' might be described as that condition where there's one tiny cloud in an otherwise blue sky, but that's not really the defining factor; a clear sky may have no clouds at all. The larger difference is that 'clear' will have enough vapor in the atmosphere to cut the intensity of the sun's glare, whereas with 'sunny' glare will be at a maximum. Therefore, surfaces will be more shiny on a sunny day than on a clear day; low albedo surfaces will also absorb more heat, making armor much less comfortable on a sunny day than a clear day. I haven't made specific rules for this yet, but the idea is there, waiting to be added.
Condensation describes a situation that produces ground cloud-like formations, where the humidity hits a certain dew point and the air turns to fog or mist. For the system, this is considered a kind of 'storm' and will be dealt with in the next step.
This leaves us with five conditions that produce clouds: overcast, thunderhead, wind storm, rain clouds and light clouds. What kind of cloud depends upon the air mass pair and the average amount of rain that falls at that station in the space of a month.
At last, we can pull up our numbers for rainfall. This is the last data we have available; the last data we need.
Palmyra has an average rainfall in February of 18.9 mm. (My reasons for using mm will become evident when we come to storms). This is not bad for a desert; it is almost half an inch of rain. As it happens, most of this desert gains a fair bit of precipitation during the winter months; Google Earth tends to show the land as bone dry because the best times to take satellite photos happens to be in the rainless summer. On the whole, Google Earth cannot help but show the earth as a much, much drier place than it actually is, since photographs of rain clouds are crappy for demonstrating the Earth's surface.
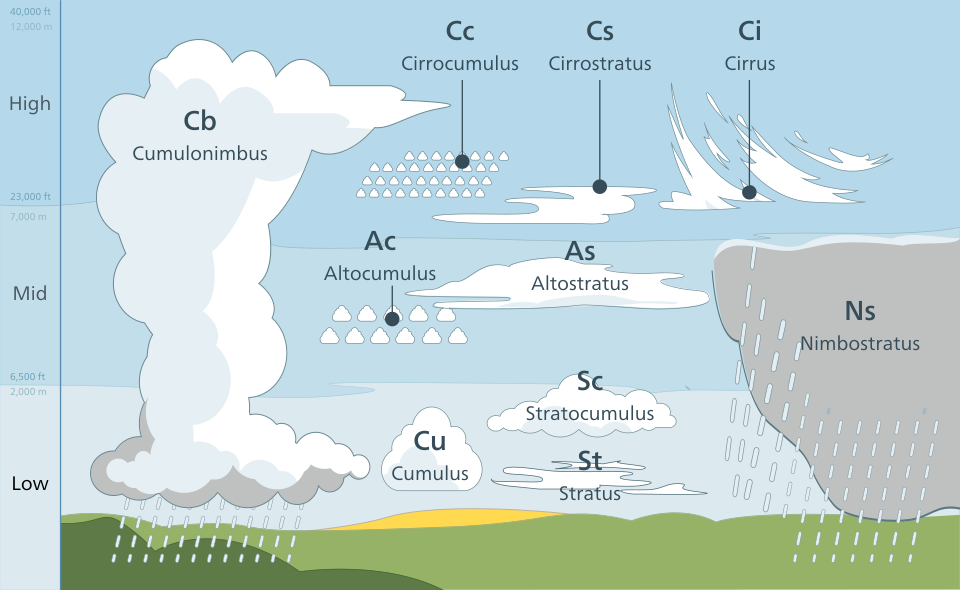
This brings us to the Clouds table:

Compare this table from wikipedia on different kinds of clouds, to better understand the table above:
 |
| I'm simplifying the above by getting rid of the nuance; how much nuance does a D&D world really need? |
Palmyra in February satisfies the criteria for the second column over. This means that for Palmyra at that time of year, 'overcast' conditions describe cirrus clouds. In a desert, this might look something like this:

In May, when Palmya's rainfall dips to 7.2 mm, 'overcast' becomes haze, a very thin layer of water vapor that dims the sky but does little else. It isn't really a cloud - but it isn't blue sky, either.
This is how I control the appearance of the weather without actually having to change the system. By hinging many of the details upon the average rainfall, 'overcast' becomes a different thing for different parts of the world and for different months of the year. This vastly simplifies the number of tables I need to just a few. In turn, the kind of cloud that is produced determines the amount of rain or snow (depending on the ambient temperature) that falls.
Note that the overcast sky most of us are familiar with in Europe and North America occurs regularly as stratus clouds, due to the amount of water in the air for climates where rainfall is high.
With the next post, I will be moving onto storms.
Well done. I am following this series closely.
ReplyDeleteI always marvel at how well-put-together your tools look from the outside. Even with the knowledge that there's always something you don't get to, or can't cover, even with the knowledge that you propose system after system and it takes you years to get one that works well, despite all that it is still so impressive. The Facebook effect, I guess - we see many more of your highlights than your failures.
I tend to clean up the tables and the images for the public readers, Maxwell. That isn't facebook, that is Years and Years of working in journalism.
ReplyDeleteI wasn't doubting that, but point taken.
ReplyDeleteThese posts will save me enormous amounts of time when I get around to making my weather generator. Not to mention they are much more elegant than what I had in mind.
ReplyDeleteOne thing I would like to point out, is that you would make a wonderful lecturer if you could deliver orally as you do here. The post is well detailed but also very fluid, and well laid out. I enjoy your writing style immensely.
On another note if you could choose the exact spacing of the weather stations what would it be? I am wondering at what point the spacing becomes to much, and where it becomes to little, having seen the map in the last post.
Connor,
ReplyDeleteWe have to remember that those weather stations are placed by experts far greater than you or I. If they feel that the distance is right to keep track of the weather in those areas, then they must be sufficient.
However great the apparent distance, we can faithfully acknowledge that large parts of the world experience a very heterogeneous climate - I doubt that the deviations over those large, mostly flat areas matter very much.
One clarification here - did you mean homogeneous climate, as in a similar climate through out? I only as as you then state that the deviations over large areas most likely do not matter.
ReplyDeleteAlso, I should clarify that I was wondering more from a data aggregation stand point. As most regions are fairly similar in climate over a fairly large area, would removing stations be possible to simplify the calculations while still retaining the desired amount of granularity?
I ask this assuming you will be calculating a fair number of locations at one time, and thus fewer data points would make the process easier. However, if you are calculating the weather one location at a time it probably doesn't matter.
Yes, sorry, I did mean "homo"geneous.
ReplyDeleteI'm hoping to make it clear that the distribution of data stations over the globe is determined by the necessity caused by global deviation. Believe me, for many parts of the world, the data stations are much more common and detailed - in part for topography and in part due to influence on weather by man-made cities/lakes. Search around on the worldclimate site; there is a table for east, west, southeast, etc; start clicking it in one direction (northwest towards europe, say) and you'll find many, many more stations.
Okay, I understand you now. Thinking on it, it would make sense that the stations are spaced accordingly to account for the deviation in weather patterns.
ReplyDeleteSorry it took me so long to catch that, and thanks for explaining it.
I'm really enjoying this series! (It's all perfect timing as I had just started scrapping together tables for weather's effects, but hadn't come close to deciding how the effects should be determined).
ReplyDeleteIf I'm not bounding too far ahead of your exposition here, how do you think you will handle regions with quickly-changing versus slowly-changing weather? I remember visiting the Netherlands and Vancouver Island, both places where an intense downpour would last an hour before the day was sunny again, until the next downpour a few hours later; while in, say, Toronto the weather usually stays consistent all day. From what I understand this is caused by proximity to the ocean.
I have contemplated those problems, Tim, but I am not ready to solve them at this time.
ReplyDelete