Showing posts with label Weather. Show all posts

Wednesday, November 29, 2023

Thorn in My Side

Of all the elements of creating and describing a setting, the most difficult is surely the weather.  Most manage the problem by pretending that the game world maintains a perfect 72 degrees at all times, that rain hardly ever happens, that the climate everywhere is more or less southern California and that there's no need to worry about it.  Players don't come to experience weather.  If they want weather, they can play outdoors.

For me, the issue that's plagued me these last ten years arises from conveying the proposed weather, or temperature, to the players.  Consider just this part:  the players wake on a morning with overcast skies; the temperature is a brisk 43° F, or 6° C.  In some measure, we have an idea of this temperature, but it must be admitted that it's easier to relate to such in October or November than it is in July.  In fact, that temperature feels very different in July.  Moreover, as I've said elsewhere, how does the player character know it's 43°?  There are no thermometers in a medieval setting.  Daniel Fahrenheit was born in 1686.  Even if someone had created settings for a tube filled with mercury or alcohol (and it hadn't caught on), that scale wouldn't have matched Fahrenheit's.

Put that aside.  Take a moment, just now, and describe 43° F to another person.  If you want a real challenge, do it without the number ... but in fact, having the number gives very little help in describing that temperature.  In general, without the physical evidence of the weather, you're sure to do a poor job.  Worse, I dare anyone to make a distinction, in words only, the difference between 43° F and 53° F.

Finally, there are many, many people in the world for which 43° F is so unlikely that they've hardly ever encountered it.  I had a friend once in Australia who lived on the edge of civilisation about 100 miles southwest of Brisbane, upon a stretch of land he'd owned.  Once, he told me, he'd woken up one morning and there was a skein of ice atop the water bucket on his back porch.  That was the closest he'd ever come in his life to experiencing snow.

So, for those living in such parts, or the reverse where they've never experienced a temperature above 37° C (for no one in such parts uses Fahrenheit), how does D&D address their needs?  How does the DM explain Sahara-like temperatures to a player in Hammerfest, who's never left Norway?

This, of course, falls into the category of Things Alexis cares about but no one else does.  For ages I've wanted to provide even a baseline of descriptions for 10-degree gradations (using Fahrenheit, since Celsius doesn't divide easily into distinctive categories) and been utterly stumped.  There are no pre-existing descriptions for weather at various stages, because, as academia would probably ask, what would it be used for?  What purpose could that serve?  Writers creating stories don't need that sort of specificity.  It's sufficient just to say, "It was a cold morning; Derek felt his flesh arise in goosebumps as he zipped his jacket closed."

Too, for a lot of DMs, the actual weather can fit into three categories: it's cold, it's pleasant, it's hot.  Nuance is unimportant.

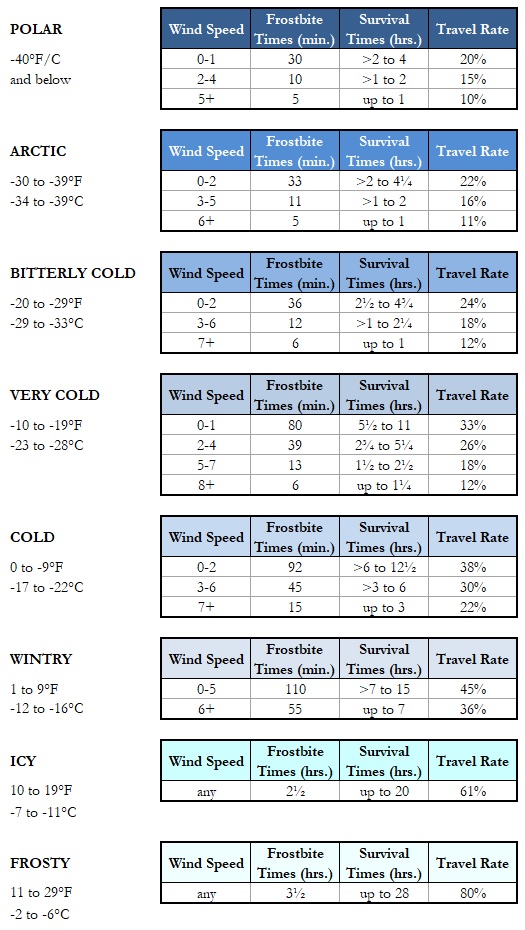
The problem has been a thorn in my side for about 12 years.  I started using "temperature grades" in my online campaign back around 2012, having divided the thermometer into gradations just before.  I've posted these on the blog before and on the wiki, but here they are again for convenience.  It's an old picture and some slight changes were made in the base temperature, but nothing meaningful has been altered.  Those who are confused by Fahrenheit numbers can find the celsius equivalents on the wiki.

The point, however, is to escape the use of numbers altogether ... to be able to tell players it's "chilly" and have them understand what the weather's like without needing to add that the temperature is about 35° F.  That's next to impossible, however; we're far too dependent as folk upon the use of numbers to equate temperature, as I've found — which is odd, of course, as for 2 million years human beings used their senses alone.

Over the years, I've spent too many hours trying to research out a description for each of these.  It's amazingly hard, as language isn't designed for the purpose ("cold" covers everything on the chart in blue) and as I said, there's no effort to describe the feel of weather on the human body in any categorical fashion whatsoever.  There are materials on how temperature affects the ability to work, but these pay no attention to temperatures below balmy on the chart shown.  There are details about clothing, or the insulation provided according to "CLO," but that pays little attention to anything above warm.  It's a part of human experience that academia has chosen to ignore entirely ... and my own attempts to build a series of descriptions based on my own experiences have been unbelievably difficult and impractical.  Thus, the problem has sat, like staring out into the rain.

"So all we could do was sit, sit, sit.  And we did not like it, not one little bit."

This last summer, I began to suspect that chatgpt might manage the problem.  It has, conveniently, much of generalised human experience at its beck and call and doesn't give a good gawddamn about the "usefulness" of a bit of knowledge or material to constrain it's usefulness — unlike, say, anything produced by a university.  I thought about what parameters ought to be considered in producing a set of descriptions and beginning with my slow onset of health on the weekend, began running some tests.  Then, last night, in the space of about 75 minutes, I created a complete list of 19 different temperature grade descriptions.  They can be seen on the live links of the wiki page linked above ... though no doubt, some readers here have already been there.

There's still work to be done on each, as the descriptions are sweeping in scope.  Necessarily, in many cases, the distinction between two different temperature grades on various descriptions are unchanged or nearly so.  Let me demonstrate, with the subject of "community gatherings," for four different temperature "conditions" between "chilly" and "pleasant":

Chilly. In the social realm, community gatherings gain prominence as people seek warmth and social interaction in inns, taverns, or communal spaces. Trade and commerce might experience fluctuations as markets witness reduced footfall due to the cold, necessitating adaptation of goods to suit the weather conditions. Character interactions deepen as the weather fosters closer ties within communities, emphasizing reliance on one another for warmth, resources, and safety.

Brisk. Community gatherings continue to serve as focal points for social interaction, but trade and commerce witness a resurgence as markets experience increased activity due to the milder weather. Adaptation of goods to suit the temperature becomes less stringent. Character interactions maintain their closeness within communities, emphasizing cooperation and mutual support.

Cool. Community gatherings continue to thrive as social hubs, fostering interactions in pleasant weather. Trade and commerce experience increased activity in markets due to the comfortable conditions, allowing for a wider range of goods without strict adaptation requirements. Character interactions retain their cooperative nature within communities, fostering stronger bonds amidst the agreeable weather.

Pleasant. Community gatherings continue to be lively social events in the agreeable weather. Trade and commerce flourish as markets witness increased activity, offering a diverse array of goods suitable for the climate. Character interactions maintain their cooperative nature within communities, fostering camaraderie and mutual support amidst the enjoyable weather.


Each gives a nuanced sense of what it's like to shop or move about an urban area given the approximate weather, in a meaningful way that can easily be applied to a D&D campaign.  Still, a lot relies on the DM to make sense of the above and extrapolate some description of his or her own ... as in, what products are available for purchase or what sort of "lively" social events might be taking place in pleasant conditions but not in cool.   "Agreeable" weather isn't "enjoyable" — but seriously, when was the last time we made a distinction like that for the purpose of game play?

As I said, these are things I seem to care about, though no one else does.  It's unquestionably difficult for a DM to make the adaptation being suggested here.  Apart from even being able to say what the temperature actually is (as most DMs have no rules whatsoever for such things, preferring the "SoCal" model), this approach asks for constant addressing of moderate descriptions and then remembering those descriptions in addition to all the other things a DM must know.  Is it worth it?  I think it is, if the DM is sufficiently invested in the concept and can properly invoke the distinctive material on demand.

But here again, we are moving forward into a very different world.  Just look at how in a very simple manner, with less than two hours work, I've been able to generate the material provided.  Consider the advancement of this material into a more interactive framework, where during a game I merely need to say to the Chatbox sitting on my D&D table, or nearby, "Tell the players what the weather is like," and the device is able to reproduce my voice, my cadence, while giving a full and indepth description, while I give my attention to other things.  I can pause and say, "Give them a little more description about what sort of stalls are included due to the city and temperature where they are," and the Chatbox does that.  Get ready, 'cause it's coming.

According to Nick Cave, supported in this reading by Stephen Frye, chatgpt is supposedly a "threat" to creativity.  What a bunch of hokum.  My contribution of creativity in this post is in no way threatened.  I saw the flaw in describing temperature.  I outlined the problem.  I foresaw the possible solution.  I selected the parameters.  I'm the one able to use the information provided for further creative ventures.

But without the technological advancement made here, without the tool, I'd still be dead in the water.  We make TOOLS as human beings to solve problems.  It stuns me that bright, capable people, standing in front of other tools and inside buildings that were invented to solve other problems can have their head so far up their ass they can't see the good of something.  That's the death of creativity, not chatgpt.


_____

If you wish to comment, please write questions, ideas or opinions to alexiss1@telus.net and they will be posted on Saturdays.  Feel free to introduce new subjects or present your own work. 

If you wish to make a donation to Patreon, it will be greatly appreciated and help with costs for illustrating the Streetvendor's Guide. 

Wednesday, August 26, 2020

Baby, I Can Warm You Up, 'Cause I'm Your Weatherman

Today's most excellent wiki page, which I've effectively rebuilt. It looks so much better.


In AD&D, Control weather is a 7th level cleric spell and a 6th level mage spell that provides a loose organization of weather types with very little exact detail about what any of these conditions will produce.  It was difficult running the spell back in the 1980s, without the sort of gritty information that is presently available on the internet.

It is particularly annoying in phrases when we're told, "obviously," that the spell must meet appropriate climatic conditions, as though we are either supposed to believe the only sort of conditions the players will every meet will be those that occur in Wisconsin, or that we are blessed with perfect knowledge of what storm conditions are possible in conditions like the African Sahel, the Brazilian Caatinga or the Yunnan Rainforest.  In 1978, when the Players Handbook was published.  It's surprising there isn't a note beneath that reading,
* Watch National Geographic, stupid.

In 5th Edition, the spell is described as an 8th-level transmutation.  The duration of the spell is drastically curtailed (from an average of 26 hours to 8), the range is much expanded and the casting time remains unchanged.  Note, please, that I charge the caster only three rounds; I don't see how more makes the spell more powerful, except that it is clearly designed not to be used in a battle.  In other words, the very powerful spell should not help 3rd level druids from casting call lightning or enabling any other caster to produce a spell based on the weather conditions.  Gah.

If at all possible, I want to produce rules related to things like spells that precisely detail what the spell will do.  Control weather has been one of the hardest spells I've had to rewrite.  I'm tremendously pleased that I'm beginning to master mediawiki's layout sufficiently that this spell can look a lot better than it did, when I edited the page six months ago.

Sunday, June 16, 2019

Describing the Weather

The survival times, I admit, aren't very clear; I haven't
yet sorted out my thinking on these.  See it as a
placeholder for the present, please.
It's my intention to post the charts shown on separate pages on my wiki, as the goal is to have a page for each temperature grade, to describe fully how a given temperature affects the character (this is a lot harder than it sounds, particularly if the goal is to do it without using either fahrenheit or celsius).  Degrees are given here for the benefit of the reader's use, who may not wish to be as orthodox as I intend.

The thermometer as we know it wasn't invented until 1714, by the Dutch scientist Daniel Gabriel Fahrenheit.  Prior to that, there were devices that had been developed and used by scientists, notably Galileo and Giuseppe Biancani, but even as various thermometers were created throughout the latter half of the 17th century, there was no standardized scale.  Moreover, these were either curiousity pieces or objects specific to scientists and laboratories.  No peasant or common townsfolk ever saw a thermometer or imagined they would ever relate the relative feel of the air to such a device.

For that reason, I've been challenged to build, memorize and convey a system to persons who are so rigidly based in measured thinking where it comes to weather, including myself.  It is virtually impossible to get a pure description of weather that doesn't turn to the thermometer to produce clarity, so that it's been uphill to explain what frosty, icy or wintry temperature "feels like," in a way that doesn't require me to say, "Oh, you know, like -6 degrees celsius."

On the whole, my goal of creating pages for each temperature grade has been a bust.  The language isn't there, the information isn't there ~ and there doesn't seem to be anyone left to contemplate that for most of human history, people never used the word "degree" to describe the weather.  It makes me wonder what that must have been like, given that I can't find any extant documents before the 16th century that discusses the "feel" of the weather in any fashion (science seems to have discovered weather in the late 1500s).  We mention storms and winter and such, and sometimes someone will say it was a nicer summer than summers past, but there's no effort at all to actually, and at length, describe any such phenomenon.  When that comes, everyone rushes to measuring the weather; it is obviously too subjective to meaningfully describe.

Try it.  Sit down and try to write three sentences that could apply to weather that's "icy," as defined above, that can't be mistaken for "wintry" or "frosty" [without using degrees, obviously] ... and yet you know perfectly well from the measurement that it is a distinctly different weather.

Even here, when I've brought up the subject on the blog, mentions of the subject have landed with a silent thud.  I seem to be alone in my curiosity about this, and certainly alone in any compulsion to address the matter in D&D terms.

Post Script,

I'll bet that the first thing you turn to if you try to describe weather is the clothing you'll wear.  No good, that's cheating.  I said describe the weather, not your tactics for dealing with it.  We can recognize the Americans by how much they're wearing here in the spring.  I remember a story that my uncle from Saskatchewan went to Las Vegas one winter ~ and was stopped by the cops there because he was wearing shorts and a t-shirt when the weather was only 58 degrees!  They thought my uncle had to be drunk.

Thursday, August 31, 2017

Hurricane Harvey

I've been looking at the website http://earth.nullschool.net, taking note of the Hurricane Harvey as it was forming and moving across the Gulf of Mexico.  Just from interest.

Here is a screenshot of what Hurricane Harvey looked like on August 24th, when we were told it was developing into a category 4 storm, the largest in 12 years:

Note the date and time on the left hand side.


And here is what Harvey looked like, 36 hours before, at midnight on August 23rd:


Harvey formed in the southeast corner of the Gulf of Mexico, which happens ~ but category 4 storms do not come from here.  The Gulf of Mexico tends to form tropical storms, not all out hurricanes. Big hurricanes usually form like Irma, right now in the mid-Atlantic.  But this is not the only confusing thing about Harvey.  Have a look at the Gulf of Mexico, just 12 hours before the picture above, at noon on August 22nd:


No hurricane.  There's a Low sitting over the Yucatan peninsula, which in the afternoon of the 22nd moves over the west coast of the peninsula.  By evening, it's evident that the Low is strengthening into a hurricane and by midnight on the 23rd, there's Harvey.  Just 66 hours later, at 6pm on the 25th, it hits the coast of East Texas for the first time.

And it has played hell with the region, as it didn't just make landfall and break up, because there was a tremendous weather system inland that kept Harvey trapped on the coast.

As I write this, on August 31, here's a view of Harvey as it pours rain on the states of Arkansas and Mississippi:


Interesting stuff.  I had seen that there was a report of another hurricane forming the same way by the 4th of September.  This morning, as I was looking at these maps, that was the forecast.

However, as I look now, that hurricane is no longer expected to happen.  Good news.  But from what I see and hear, it could take three weeks for the water to drain off East Texas.  I also hear this is in great part from the failing of East Texan communities to spend a proper budget on drains, not to mention an irrational attitude towards zoning, that prohibits the sort of urban planning that would make it possible to shake off a storm like this when it happens.

I don't know what people are thinking where it comes to this sort of thing.

Wednesday, December 7, 2016

Wearing Clothes


The above table can be downloaded from my wiki, at this page.  It is perfectly safe, I assure you.

As the wiki says, the table is intended to simplify difficulties surrounding the wearing of clothing in different weathers, with the general purpose of assigning damage to those who wear too much clothing or too little.  I have not made a practical use of this table: it has come into existence due to collaboration with the players of my Juvenis campaign, which has not been around as long as a week.  The work could not have been done without the help of Dani, a regular contributor to the blog, an ex-student of my tutorials and one of the persons running in the Juvenis campaign.

I hope that the generator will be of help to other DMs in other games.  I've played around with it a bit and I'm very pleased.  I'm sure my players will be, also.

Monday, October 10, 2016

A Startling Wind-based Website

This is pretty sweet.  The link is a current surface wind map showing in real time.  I caught the picture below at 6:30 PM EST, Oct 10, 2016:


This was sent to me by a reader, who suggested that I might find some utility in it.  I wish.  Unfortunately, unless my game is actually taking place on October 10th, the details have limited practicality.  But this is so cool.

Using hurricanetrack.com, which gives information on hurricanes in real time (also; I love this modern age), I was able to identify that the hurricane north of Puerto Rico is Nicole, which will give some rain to the Bahamas but is expected to take a circle out to sea and die in the north Atlantic, as many hurricanes do.  So no worries with this one; the reader can see from the map that Matthew has completely dissipated.  I'm sorry I didn't have this site two days ago.

Compare the map above with any weather systems map you care to find.  The website will show any part of the world the reader cares to see.  The Antarctic is fascinating, a massive land-based high surrounded by violent lows.

There are also options for ocean currents, for chemicals in the atmosphere and for particulates.  The latter shows a tremendous flow of particulate snow falling out of the Sahara:

Also shown in real time.  To see it, click the earth link in the bottom
left hand corner.

I have no idea how I could use this, but it sure is awesome.  Thank you Erich.


UPDATE:

I am beginning to suspect that it is NOT real time video.  After many hours there are no appreciable differences.  I feel I have not correctly understood what is being depicted.  It matches up with the weather site I've linked but doesn't seem to be updating from hour to hour.  I'll have to see what it looks like in the morning.

Friday, April 10, 2015

Weather System Mark 6 - Conclusion

Step 7: Lay-out

All that's left to do is to put the data together - specifically the data that will be beneficial in the moment-to-moment campaign.

By the way, I never did explain about the 24hr average temperature.  That comes in handy because there are holes in the station research - many of the stations do not have a minimum/maximum average listed.  Palmyra, for instance.  However, by comparing Palmyra's 24hr average with another nearby station with that data, we can reasonably estimate Palmyra's own min/max averages.  For those of you who may be thinking about using data from the climate database (in accordance with this comment), use stations where both a minimum and maximum average is available.  Also, many stations don't include rainfall.   That will mean that has to be guesstimated by me also, or else found on the internet from another source.

Where are we, then?  We have the complete information for the four stations surrounding Palmyra (or wherever) that we need to create four different air masses converging on Palmyra.  That was last discussed when we talked about winds and other trends.

Obviously, the party on the ground cannot experience all these masses at the same time, so what do we do?  Rather than try to produce a conglomerated wind pattern (which would take a lot of time and not be especially useful for play), we can roll a d4 to determine which of the four generated conditions the party is experiencing at this moment.

Yes, I understand, that seems horribly random.  We've gone this distance and it would seem that all four wind shear patterns ought to be reflected.  I agree.  So bear with me for a minute and I'll explain.

Oh, and I should address those who will be thinking that the conditions to the east, north, south and west ought to reflect the player's position compared to Palmyra.  To that I say that weather shifts and moves about a great deal more than that; besides, Palmyra is in the center of a general area - it doesn't represent a fixed point past which the weather changes like crossing a boundary.

For the present incarnation, I intend to use the d4 to determine which weather conditions apply to the party, when they're in the climate area defined as the Palmyra province (we must call these areas something).  However, at some future point we can construct a windrose for Palmyra (and everywhere else) that will indicate prevailing winds in the area (even broken down by specific seasons).  In that event, one of the adjoining stations will send conditions to Palmyra more often than others - so that it might eventually be a d20, with Hama being 1-2, Deir Ezzor being 3-7, Rutbah being 8-12 and Irwaished being 13-20.  Or some other combination.  That way, the random number would favor the most common prevailing direction of the wind, not just for Palmyra but imaginatively throughout the whole system.

Very well, suppose we show what the final results look like.  For this, I'm going to take a screen shot of the excel page as well, to make it easier for readers to find what they want when finding the program on the wiki.


At present, the program has a feature that will allow any month to be selected.  That would be cell B1 on the Night Data sheet.  I need to spend a little time making another feature that will set the generator at 'Day' or 'Night.'  At present, the worksheets are called 'Night Data,' 'Night Pairs' and 'Night Blocks' to remind me that I haven't done that yet.  I'm afraid that means, at this point, that only night data is being generated.  It's not a difficult fix, but my concern has been elsewhere.

The 'Blocks' page, then, shows the final details we want.  (I added two more stations last night, anticipating my player's journey beginning this Saturday towards Egypt).  The boxes in green indicates the latitude (on the side) and longitude (at the top).  Eventually, the page data will be expanded as I add more stations.

That is a great part of the benefit of this system.  I don't have to include ALL the stations for it to work.  This means I can work on stations that are relative to the party, slowly building up the content until, like my maps, it covers a huge area.

It also means that if there are nine stations in a small area, I can always get by with doing one or two for the time being, ignoring the others until greater accuracy becomes important.  North of Damascus, for example, is a place called Rayack; if the players pass through Rayack, I can still use the data from Damascus.  Given that most campaigns have NO such data, this is still a great improvement - and it means I don't have to kill myself doing weather tables ad nauseum.  I can do what I need and the system does not suffer.

It means that if you want to use something like this for your world, stealing appropriate data from wherever (the North Kingdom in Greyhawk is a lot like Labrador, say), you don't have to grab hundreds of different stations.  You can actually get along with a minimum of five - then add a few more each time you want to expand your party's range!  The data showing in the above image required the data from just 16 stations.

What do we have, then?  Mount Keenan and Tripoli are each experiencing a quiet downpour, but Beyrut between them is sunny and dry (squall line).  There's a wind storm blowing across Damascus and Hama, but Palmyra is overcast with cirrus clouds.

The temperature is cool in Beyrut and Mt. Keenan, brisk in Tripoli, Hama and Damascus and chilly in Palmyra (just above freezing).  The wind is blowing from the northwest in Palmyra (probably the edge of the cyclone emerging from that windstorm to Palmyra's west) and is unstable everywhere else but Beyrut, where the wind is blowing gently from the south (a light air).  That wind 'storm' in Damascus isn't very strong (the 'eye'), but perhaps it is high in the atmosphere.

All this I get at a glance.

I've left open spaces on the blocks for other details that I will add later (appearance of a tornado, for instance) - and the size of the blocks can be expanded.

When I fix that day/night thing, I'll be sure to repost the program.  In the meantime, I hope the reader has some fun with it.  I'm going to move onto something else (though I will still be working on weather for myself), probably working on the wiki and working towards implementing wilderness damage.  Now that I have a working weather table, I can get right on that.

That's why I pushed to make this thing, after all.

UPDATE

Scratch one problem.  A day/night tab has been placed on the file.  Forgot to change the worksheet tab names, however.  Oh well.  I'll do it later.  Be sure to download the file named "2015 Climate Generator" for the right version.

Weather System Mark 6 - Storms

I am nearly done with the system as it stands so far.  It isn't finished.  All that I've designed so far does work, however; and there is room for adding the little details like tornado and such - though I need to think on the best method for that.  Right now, we can finish up the fundamentals; for what it does, the system stands on its own at this point.

Step 6: Storms

There are four kinds of storms from the list of conditions described yesterday:  condensation, thunderhead, wind storm and rain clouds.

If there is a weak point in this system right now, I would say that it is that thunderheads occur more often than rain clouds, due to the pair system I've designed.  I can think of ways I might tweak that - but for today, let's just go with the system as is.  Rain is rain.  Let's deal with each type of storm one at a time.

Wind Storm

Storms produce precipitation or, in the case of wind storms, particulate matter.  The wind 'storm' is the downburst, remember, so it is responsible for throwing up dust and sand, for the kind of storms characters don't want to be in.  Most of the time, however, a wind 'storm' will exist in fair conditions - which in this system means that the air is clear because it isn't dry enough.

These storms are connect to the amount of precipitation and the wind storm is no different.  If the average rainfall for the month is below 15 mm, the ground is considered very dry and the wind storm will include blowing grit.  These are the kind of conditions where the visibility is relatively clear but it is difficult to see comfortably due to particles in the air.

If the rainfall is half as much, 7.5 mm, the blowing grit will be upgraded to a dust storm.  This is even less pleasant.  Full on dust storms will never occur in many parts of the world.  At some point, there would be a way to adjust the average rainfall for a given region, so that a given month of a given year wasn't a static number, but that's a future notion.  For now, if the players aren't in a part of the world where it is very dry, a dust storm won't happen.

If we half the rainfall again, so that it is no higher than 3.75, then we have a sandstorm.  In some parts of the world, like the upper Arabian peninsula (such as around Palmyra), there isn't enough sand to create a legitimate sandstorm, but we can treat it as an intensified duststorm.  There are months of the year when Palmyra and other nearby places get zero rain for two or three months.  Those times of the year would be full of sandstorms.

Condensation

I mentioned yesterday that I was treating 'fog' as a storm.  That is simply convenient.  Fog is a kind of precipitation and for our purposes covers a wide range of possibilities.

The trickiest thing about precipitation is accounting for the temperature, for at certain temperatures fog and rain manifest as other conditions.  Nor is it as simple as saying that drops falls as either rain or snow; there is a mid-point there where it falls as sleet.  Moreover, there is room for describing the types of snow, based on the total amount of precipitation . . . but I have decided not to include that yet.  That design, too, is for another day.

To determine if fog occurs when 'condensation' conditions are indicated, we roll a percentile die under the amount of rain in mm.  This is the reason for using mm and not inches.  I am judging that any part of the world that drops more than 100 mm in the space of a month will produce precipitation if the conditions are right (LH, HL, etc.).  I could as easily make it a d120 roll, as this is excel, but 100 is a nice, round number.

If the number is below the amount of rainfall that occurs, then fog will happen.  Palmyra in February, remember, has a precipitation of 18.6 mm.  That means an 18% chance of fog when condensation occurs.  Since condensation as a condition occurs rarely, fog is equally rare in Palmyra (and would likely last just a few minutes in the morning when it did occur - again, time not included in the system yet).

However, if the temperature is less than -35F, something that never happens in Palmyra, then the fog is frozen fog.  Between -35 and 27 above zero (Fahrenheit), the fog never condenses in the air but it does produce hoar frost.  A little bit warmer, up to 33F, and this becomes rime.  Finally, above 33F we get fog.

But if fog doesn't occur at all, there is a chance we will get mist.  Mist has an equal chance of occurring if fog has failed to appear.  If the temperature is 33F or less, then mist manifests as simple frost.

If we get neither fog nor mist, there is an equal chance again for a thin mist (typically just above the ground, having no effect on visibility.  Again, if this happens in 33F or less, this thin mist manifests as a 'freezing,' which describes where frost is so thin it is merely a slight layer of crystals that have frozen over a surface, making it cold to the touch but producing a layer that is relatively invisible.

Finally, if all of the above fail to occur (and in Palmyra that is any roll above 55), the result is dew; in 33F or less, this translates as a thin cold surface that will melt from body heat.

Rain Clouds

Like condensation, the results here are greatly dependent upon the temperature and the likely amount of rainfall.  Primarily, however, it is the type of cloud determines the kind of precipitation.

Altostratus clouds, which are quite high, will produce falling ice crystals below 33F and spattering rain otherwise.  The chance of this happening is again a d100 calculated against the mm of rain at that station in that month.  A failed roll produces no rain at all.  Some might remember that altostratus are the only kind of rain clouds that occur in desert conditions.

Stratus clouds always produce rain if the conditions are right.  However, the type of rain will depend on whether or not the d100 is less than the number of average mm for that station for that month.

If the roll is positive for the stratus cloud, then the rain will be enough to wet the environment.  If it is 33F or less, then this will fall as a snow flurry, medium sized snowflakes that fall quickly or are blown.  Otherwise, the status cloud will provide pelting rain, being hard, small drops.

If the roll is not positive for the stratus cloud, then it will either be tiny, hard snowflakes or spattering rain, depending on the temperature.

Remaining rain clouds will be cumulus clouds, or cumulonimbus on yesterday's cloud image.  To determine the intensity, the d100 is rolled against the average mm x2.  (For Palmyra, that would equal a 37% chance - 18.6 x2).

A more intensive precipitation will either yield a snowfall or a shower, each of which will either lay 1-4 inches of thick snow or thoroughly drench the environment.  A less intensive precipitation will either produce a softly falling snow (large flakes, typically an inch of snowfall) or a drizzle.

Thunderhead

These are typically nimbus clouds (either stratonimbus in cold climes or cumulonimbus in warmer climes), producing lots of rain.  First, we again roll a d100 to determine the intensity, with the average monthly mm x2 (37% again for Palmyra).  A success would indicate one of three types of precipitation, depending on the temperature.

If less than 31F, this is a blizzard, a full on snowstorm with low visibility; thunderheads tend to include a high wind as well (generated by other means, the reader will remember).  Between 31F and 33F, this falls as sleet - wet, slashing snow-rain that is very unpleasant.  Above 34F but below 69F, this is a quiet downpour (it isn't warm enough for thunder and lightning), which will drop more rain than a rain cloud shower but won't look much different from the ground.  Finally, at 70F and above, we have a full thunderstorm.

An unsuccessful roll against the average monthly rainfall will indicate that there are dark storm clouds overhead, but no rain will fall before these clouds move on.

In a desert climate, thunderheads manifest as cumulus clouds.  Like with rain clouds, these will either produce ice crystals or spattering rain (if a d100 is successful, dependent on temperature) or merely pass over as dark clouds.

This covers storms for the time being.  I can and will expand this, probably one feature at a time, but for the present it is clear that different conditions/temperatures will produce distinctly different precipitation.  This is all programmed in, so if I change the temperature the excel does all the work for me (no tables to look up!).

Ultimately, I'd like to write a list of effects for each kind of precipitation (and a lot of other features as well), to make this more detailed and precise in-game.  Last night I did a little work on pleasant temperatures and warm temperatures.  Worth a look; the beginning of a long series of wiki pages.

The last post in this series will be up in not very much time.


Thursday, April 9, 2015

Weather System Mark 6 - Ground Eye's View

This is the fourth post in this series on the mark 6 weather system.  Be sure to start at the beginning with this post.

We've come to the point where we're ready to start generating things from the character's point of view.  The movement of air masses sounds very interesting to us, but none of that can be seen or understood by the character, so in the long run this is just a way to describe the data we're using, so that when we decide to muck about with that data later, we know what generated what.

We've managed to create some very interesting effects with very little data.  It's time to take this foundation and throw a few dice - or rather, to have excel produce some random numbers.  I'm sorry, this system simply isn't designed to satisfy the mechanic of using dice.  Dice, I would have to argue, would severely retard the elegance of the system; I'm not prepared to break the system just so it can submit to the use of a 16th century technology.

Learn how to use excel.

Step 5: Conditions

We have eight varieties of 'Conditions,' as introduced in the last post:  sunny (HH), overcast (LL), thunderhead (HL), wind storm (LH), rain clouds (HM), light clouds (MH), condensation (LM) and clear (ML & MM).

Weather forecasters use the terms clear, sunny and fair interchangeably, so the differences tend to depend upon the meteorologist's personal perception.  Here's a good description of the real world difference from the Chicago Tribune.

I said at the beginning, however, that the real world could go hang.  For this system, the difference is a question of light refraction.  Both conditions lack clouds.  'Clear' might be described as that condition where there's one tiny cloud in an otherwise blue sky, but that's not really the defining factor; a clear sky may have no clouds at all.  The larger difference is that 'clear' will have enough vapor in the atmosphere to cut the intensity of the sun's glare, whereas with 'sunny' glare will be at a maximum.  Therefore, surfaces will be more shiny on a sunny day than on a clear day; low albedo surfaces will also absorb more heat, making armor much less comfortable on a sunny day than a clear day.  I haven't made specific rules for this yet, but the idea is there, waiting to be added.

Condensation describes a situation that produces ground cloud-like formations, where the humidity hits a certain dew point and the air turns to fog or mist.  For the system, this is considered a kind of 'storm' and will be dealt with in the next step.

This leaves us with five conditions that produce clouds:  overcast, thunderhead, wind storm, rain clouds and light clouds.  What kind of cloud depends upon the air mass pair and the average amount of rain that falls at that station in the space of a month.

At last, we can pull up our numbers for rainfall.  This is the last data we have available; the last data we need.

Palmyra has an average rainfall in February of 18.9 mm.  (My reasons for using mm will become evident when we come to storms).  This is not bad for a desert; it is almost half an inch of rain.  As it happens, most of this desert gains a fair bit of precipitation during the winter months; Google Earth tends to show the land as bone dry because the best times to take satellite photos happens to be in the rainless summer.  On the whole, Google Earth cannot help but show the earth as a much, much drier place than it actually is, since photographs of rain clouds are crappy for demonstrating the Earth's surface.

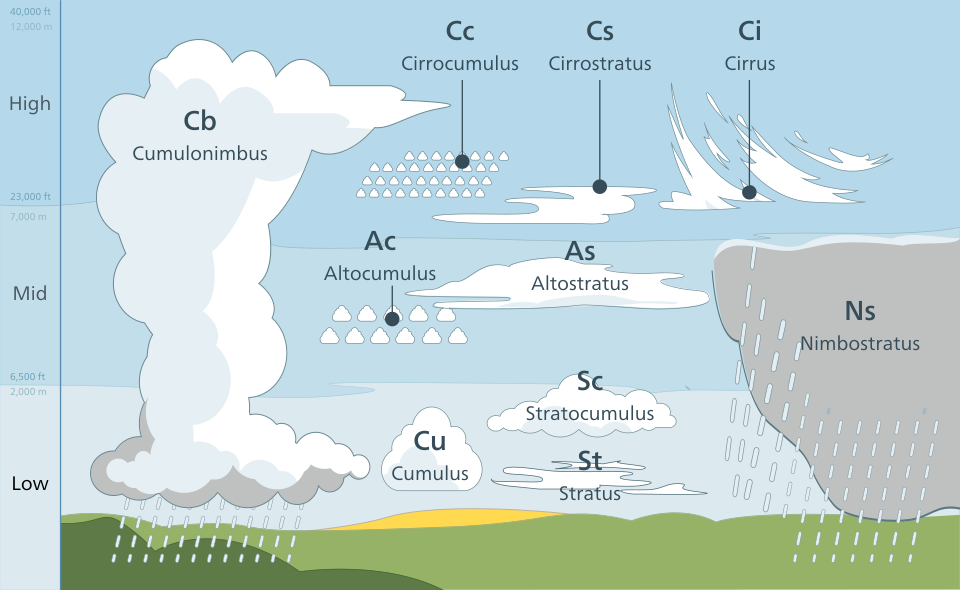
This brings us to the Clouds table:


Compare this table from wikipedia on different kinds of clouds, to better understand the table above:

I'm simplifying the above by getting rid of the nuance; how much
nuance does a D&D world really need?

Palmyra in February satisfies the criteria for the second column over.  This means that for Palmyra at that time of year, 'overcast' conditions describe cirrus clouds.  In a desert, this might look something like this:


In May, when Palmya's rainfall dips to 7.2 mm, 'overcast' becomes haze, a very thin layer of water vapor that dims the sky but does little else.  It isn't really a cloud - but it isn't blue sky, either.

This is how I control the appearance of the weather without actually having to change the system.  By hinging many of the details upon the average rainfall, 'overcast' becomes a different thing for different parts of the world and for different months of the year.  This vastly simplifies the number of tables I need to just a few.  In turn, the kind of cloud that is produced determines the amount of rain or snow (depending on the ambient temperature) that falls.

Note that the overcast sky most of us are familiar with in Europe and North America occurs regularly as stratus clouds, due to the amount of water in the air for climates where rainfall is high.

With the next post, I will be moving onto storms.


Weather System Mark 6 - Wind & Other Trends

Step 3: More Stations

When working on any new project, I always end up having to graph out certain elements in order to keep them clear in my head.

This is the Stations Map:


The lines are tenths of a degree of latitude or longitude.  This particular part of the world, surrounding Palmyra, is comparatively short on stations, so the distances are greater than they would be for Europe.  However, since this part of the world also experiences a more homogeneous climate than Europe does, we need less stations.

What we want are four stations surrounding Palmyra, each of which are calculated the way that Rutbah was in the last post.  This gives us four different comparisons with Palmyra, so that we can see the movement of air between four different 'pairs' at a glance:


We don't need the temperature right now, so we can concentrate on the air-masses alone.  The table above shows how the four stations around Palmyra affect the weather there.  The "Higher" column indicates the station with the higher elevation.  I've designed this so that the reader can clearly see that Palmyra - H & Hama - L make the pair 'HL.'

Elevation for the station is given as a number after the station name.  Note how Palmyra is lower than Rutbah and Irwaished, but higher than Deir Ezzor and Hama.

Because LH and HL are both "storms," the wind direction is unstable for the entire region.  Both the higher stations are producing downbursts into Palmyra, while the lower stations are experiencing an inversion wind shear with the warm air emerging from Palmyra.

If the reader looks at the map, however, it will be noticed that Deir Ezzor is directly north of Rutbah - and ultimately, those two stations ALSO form a pair.  Rutbah's weather would also be directly affecting Deir Ezzor just as it does Palmyra - and that pair's code would be 'LL' (subsidence).  This gives us a pretty stark indication of where the storm begins and how far it reaches.

What we have, on the whole, is a High sitting overtop of Palmyra, getting blasted with cold air from above, then hitting the cooler air to the northeast and west.  The atmosphere is swirling and wind directions are shifting from hour to hour (unstable).

All this from very little data.

There are two important points we want to take away from this, giving us both good and bad news.

The bad news is that when I recalculate, the numbers will change and the weather pattern will produce something potentially different.  The most common pair that will come up is LL, because this is night (remember?) and the way the system is designed, night time temperatures have a 2/3rds chance of being below the average mean.  Most of the time, LL will come up all across the five stations and the weather will be a gentle subsidence in the direction of the lowest elevation.

However, we don't have to say that any given situation lasts a day!  We can roll a d4 and propose that the latest conditions last 1-4 days.  It is up to us.  That, however, is beyond the point where I've reached; at the moment, I'm just trying to get these patterns to manifest rationally.

The good news is that every station everywhere in the system is linked.  They don't interact in different tables; they interact altogether, at the same time.  Therefore, the air mass out of Rutbah that affects Palmyra also affects Deir Ezzor and Irwaished, as well as stations to the south and east, which are in turn affected by stations around those and so on, potentially right around the globe.  If we wanted, we could create an air mass chart for the whole system.  If I had the ability to program a visual tool, that chart could be automatically generated!

Sadly, however, excel is as far as my expertise takes me.

Step 4: Wind

So far, I have done the work for four stations: Palmyra, Hama, Tripoli and Beyrut.  This is the direction I expect my players are going to take the next time they run, as they are bound for Egypt.  Here's a complete list for all the pairs affecting those four stations (things are going to get a wee complicated now):


As the reader can see, I've added wind information for each pair.  We'll get to that in a moment.

It would be easier at this point if the above table were organized visually in a way that mapped out the pairs in a 2-dimensional fashion, like the stations map above.  However, in the end there are going to be thousands of pairs; and I only need this chart as reference for the next chart.  I felt, therefore, that the reader ought to look at this the way I have.  As a mass of data that has to be pieced together visually inside our heads.

Note how Hama having a high in the above creates swirls and eddies all around it, as does the one pair between Irwaished and Palmyra.  Were I to recalculate the table, that would change; sometimes every pair from top to bottom is LL.

Wind Shear is the effect of the paired air masses we've been discussing since the last post.  Wind direction is determined by the movement of air; most of the time at night, this will be either be subsidence or unstable masses churned up by a night time high.  Note that in the daytime, the most likely pairing is HH, so that most wind movement will be up elevation, not down.

Conditions are a more descriptive term for what is actually happening visually from the character's point of view.  Characters don't understand words like 'subsidence' and 'downburst.'  For them, explaining that there are thunderheads, a wind storm or that it's overcast makes much more sense.

Now, some readers will be realizing that this area is a desert and the 'overcast' doesn't make much sense - particularly if LL is common and means that an overcast is occurring.  Well, settle down; I do take that into account later.  For now, don't read too much into the term 'overcast.'  It is, at this point, a loose framework upon which we shall hang other details.

Wind speed is determined by the amount of drift we generated two posts ago. Remember drift?  Drift was the difference between the randomly generated temperature and the mean.  Drift told us that the station was experiencing a H, L or M air mass.  Well, the amount of drift determines the wind speed.

Take the example above:  Irwaished's drift is 12, whereas Palymra's drift is -1.  The difference between those two drifts = 13.  Because the local wind shear/conditions are an inversion/thunderhead, this number is taken as read and the wind speed is 13 mph.  On the Beaufort Scale, this gives us a moderate breeze.  That looks like this:


The wind speed is modified by the given pairing.  HH and LL both cut the wind calculation by 50%.  HL, the inversion, takes the wind speed as calculated.  LH, the wind storm, increases the number by 20%.  HM, the unstable thermal, drops the calculated number by 50% as well; a stable thermal, MH, to 40% of the total.  LM, the downdraft, reduces the number to 10% of the total and the adiabatic cooling, ML, to 30%.  These numbers are entirely ad hoc, but it 'feels' right.  Where am I going to get accurate numbers for this sort of thing?

Having made the calculations with excel, the last column calculates the Beaufort scale.  I don't know what 13 mph looks or feels like, but I can make a reasonable assessment from the above image and description.  I find that extremely helpful.

Excellent.  We're making headway.


Wednesday, April 8, 2015

Weather System Mark 6 - Temperature

Apparently, I'm in the mood to write another one today.  Okay.  The weather system mark 6.

If the reader has exhausted their way through this post and this post, it should be fairly clear that I'm building a case.  I wish to discourage thinking that what follows is meant to be a simulation.  It is not.  From the point of view of meteorology, what follows is utterly ridiculous.  But I am not attempting to convey science or reality.  I'm wishing to take a set of facts and use them as a guideline to produce credible results that may reasonably be mistaken for 'local weather.'  That is all.

What weather actually does, or how weather actually works, is immaterial.  I have performed exhaustive research to get to this point, so I am well aware of how weather works - educating me on this point would be a waste of everyone's time.

Beyond this point, the only thing that matters is the structure we want to create.

I've covered some of this before, but let's recap: we want to produce a series of weather tables that are consistent with our position on the planet and the season that it is, along with whether it is day or night, so that the temperature, rain, wind direction, wind strength, amount of precipitation and even the cloud structure is known - and from those principles, we hope to eventually produce further embellishments that will allow for idiosyncrasies like tornadoes, hurricanes, ice storms and so on.

Oh, and if we could have it all on one table, that would be nice.

Our data will be coming from worldwide weather stations included in the WorldClimate.com website.  Here is the data from the website that we will be using:

  • average minimum temperature for each month
  • average maximum temperature for each month
  • station latitude
  • station longitude
  • station elevation
  • rainfall in millimeters for each month
  • 24hr average temperature for each month (when average min/max is not available)
That's it.  That's the whole data we will be using.  Before going forward (and the reader should be asking "Whhaaaaa-?" at this point), consider:  it means that for your world, the world that has no relation whatsoever to our world, you need to invent very little data of your own to make your weather system work.

That is a plus.

Step 1: Temperature


Because my players are near Palmyra, that being the nearest data station to their location, I have decided to begin with Palmyra station.  The time of the year is February - and for Palmyra, I have two numbers:  Average minimum: 38.2F.  Average max: 58.7F.  We can presume that the minimum is the average temperature at night and the maximum is the average temperature during the day.  What we want is a random number for night-time temperature and a random number for day-time.

Very well, the mean for these two temperatures is 48.5F (rounded).  This is the 24hr average temperature for Palmyra in February.  From this, let's perform a simple calculation.

The average minimum, or low, or night time temperature, is not quite 10.3 degrees below the mean.  Let's subtract that number from the average minimum to get a minimum low (not an average) that drifts all the way down to 28.0F.  This puts 38.2F exactly halfway between the very bottom temperature and the 24hr temperature.  Are you with me so far?  No?  Well, let's make a little chart.

All this average minimum & maximum/24hr nonsense is getting confusing.  So let's get rid of it.  Let's call the very bottom temperature, the coldest we expect it to get in Palmyra in February, the Minimum.  Not the 'average' minimum, just the plain, simple, minimum.  That's 27.9F.

Let's call the 'average minimum,' the number we get from the climate site, the Low.  That's 38.2F.

The Mean is the middle number.  That's 48.5F.

The 'average maximum' is the daily high, so let's call it the High.  That's 58.7F.

Then, if we add that same 10.3 degree difference between the mean and the daily high, we get the Maximum.  That's 68.9F.

See?  Simple:


Now we can construct an average night time temperature (we won't worry about the day for this post).  It won't be any fun if the spread is between the Minimum and the Mean, so let's produce an average number between the Minimum and the High.  Yes, that will mean that the "Low" is no longer the average low, but f* all that.  We're creating here.

So, night-time temperature will be a number between 28 and 58.7.  We want that to be a bell curve.  This is really easy on excel; the way I've done it is to create two random numbers between 28 and 58.7, then divide both by 2 and add them together.  The bell curve peaks around 43.4F.

This gives us our temperature.  In excel, this gets run through a bunch of if statements that determines what the 'temperature code' is - but that's not important just now.  Let's move on.

Now we want to create something called "Drift."  Drift is the difference (expressed as an integer) between the randomly generated temperature and the Mean.  Therefore, if the random number for our night time temperature turned out to be 35F, the drift would be -14.  This exact number will matter later.

If the Drift is less than the Mean, then we can say something about the local air mass over Palmyra that night.  We call call it a "Low."  This is weather parlance and shouldn't be confused with the nightly Low temperature.  Here we are speaking of an air mass that is cold and dense, therefore having a tendency to move downwards in the atmosphere.  For ease, we can shorten 'air mass' to simply Mass.

If the Drift is higher than the Mean, then the Mass is a High - a warm air mass that is less dense and has a tendency to move upwards.  If the Drift equals the Mean, the Mass is stable and not moving.  The movement of warm and cold masses fits with ordinary atmospheric mechanics.

So now we know two things about Palmyra.  We know what the temperature is and we know the nature of the air mass surrounding the station.  We're ready to move on.

I'm going to post this and keep writing.

The Weather Problem Attempted

I have made five previous attempts over the course of my Dungeon Mastering to produce a working weather table.  The impetus was the AD&D Wilderness Survival Guide, on the whole an extremely disappointing book.  I'm sorry to disparage - it is only that the gap between what was hoped for and what was received was immense.

See, next to my computer, within arm's reach, I've been keeping a book called Mountaineering - the Freedom of the Hills.  I have the 6th Edition.  It weighs about 1.1 kilos, has 528 pages and costs $32.

On the other hand, the Wilderness Survival Guide weighs about 0.25 kilos, has 130 pages and set me back $20 in 1986 money.  In fact, this inflation calculator says I paid $42.50 in today's money.  But I quibble.

The AD&D WSG was a game attempt.  It is far more content-deep than any of the splat books put out since the 1990s, but most of the rules weren't practical - or rather, they depended upon poorly defined variables that made them unusable.  For example, the rules on page 36 for "chance of stopping a fall or tumble" depend on the DM judging whether the slope is non-slippery, slightly slippery or slippery, versus gentle, moderate, severe and cliff-like slopes.  Such attempts to discriminate, to make the rules more 'detailed,' nearly always end in arguments over gray areas, while in fact making the rule hard to memorize (a principle that is ignored throughout the book), made worse by the designers insisting on using fractions instead of percentages.

On the other hand, my mountaineering book spends 55 pages describing surfaces in excessive detail, in every way possible, right down to the right equipment for the right surface.  No, there are no tables; but tables I can create.

All this has a point.  I and others recognized the failure of the WSG right off.  We had many talks about how to improve various points.  Viewing it from the present vantage point, it did serve to inspire us to produce something better.  We saw what was there and recognized a need for details that we had never properly considered.  It opened our minds in a hundred ways.

A pity that the book didn't solve those problems in addition to pointing out that these were problems that needed attention.  But there are many, many early books in the sciences that fell short in the exact same way.  Freud, for example, became the Father of Modern Psychology that way.

Much of what I've written on this blog does this also.  Oh hey, look at this problem.  Here's an attempt to fix it.  Oh, shit, that didn't work.

The longest lasting influence of the WSG has been, without a doubt, those damn weather tables that began with page 107.

For those who have never seen the guide, the weather table was ingenious.  Or so I thought in 1986.  The world was broken down into Arctic, Subarctic, Temperate, Subtropical and Tropical regions.  Temperature was broken down into 26 grades of temperature ranging from extremely cold to extremely hot.  These grades were each assigned a letter, A to Z.

Then, for each month, for each climate and for each type of terrain (desert, forest, hills, mountains, plains and seacoast), the book gave three letters.  For example, for temperate plains in January, the letters were B H M.  'B' had a high of -15F and a low of -30F.  'M' had a high of 65F and a low of 45F.  'H' was supposed to be a kind of average between these, with a high of 30F and a low of 15F.

According to the rules, the temperature would swing back and forth between B and M throughout January, based on a random system the designers proposed.  It sounded very exciting and interesting, and I threw myself into it full bore.

Only, I had climate data for different parts of the world even then, in my World Almanac, so I ignored the table provided in the WSG and spent a lot of time making my own letters for real places.  Then I tried to use the system and made my first big discovery.

Weather is not temperature.

Oh, the WSG tried to include random tables for rain and wind as well, but those tables were absolute shit.  I tried using them.  Then I tried fixing them.  Then I tried a bunch of my own efforts that failed.  All this was done in the dark ages, for me, without Excel and without a better computer than a Commodore 64.  64 whole kilobytes of RAM.

When the Mac OS at my university came available to me (I didn't have money to buy my own) I tried again using Excel.  That would be my second attempt.  It was, I'm afraid, no better.  The problem was a lack of data, a lack of experience, a lack of knowing what was important for the game, a lack of perspective and definitely a lack of detailed, well-designed world to graph any climate system onto.

In other words, without the strong platform provided by my maps, which did not even begin to exist in their present incarnation until 2005, any attempt at creating a weather system to match was doomed to be hopelessly and uselessly random.  That's what I found with both those first two forms; no matter how much work I poured into them, the constant randomness is what broke the system.

Weather has to shift back and forth within a very small box - the two cats I spoke of in my previous post.  In turn, those small shifts have to matter, or else they're so small they can be ignored.  I wasn't getting anywhere with the WSG's idea . . . though the temperature scale that was proposed in 1986 still survives today in my world; adjusted in both degree [zing] and purpose, but still there.

My 3rd attempt began on this blog.  On the whole, I couldn't really call it a system.  It was an idea, at best, one that didn't make it out of the experimental stage.  I never applied it to my world.  It was too vague and non-specific.  It was part of the process that got me here, however, as I realized that details really did matter.  At the time that I posted that, back in October of 2008, I was just starting to play with the idea of doing something.

I am amazed, sometimes, at how much my world has changed since 2008.  One would think that after 28 years of game-play that I would have calcified my design by now, but that is anything but the case.  My world is vastly different from anything I played before 2000, quintessentially redirected from what it was when my daughter started playing around 2007 and it continues to shift and change, both in design and in function.

My 4th attempt can still be found on my wiki.  If the reader likes that file, better save a copy because within a few months it will be going bye-bye.  I don't use it anymore, but I'm fine with leaving it up until I'm ready to put up its replacement.

My 5th attempt was going to be an in-depth rework of the 4th system, but in the middle of working on it (and nearly finishing it) I had an epiphany.  That is when I started working on Mark 6, about six months ago.  The first four months of that work was done all in my head, but that's not important.

The 4th system that has been on the wiki was the closest I've ever come.  Unfortunately, it still suffers from too little or too much deviation, and defies attempts to expand or modulate the results.  It's difficult to say what the problems are.  Partly, it depends too much upon information that isn't available for the whole world.  Partly, it micromanages too many details past the point where they need to be managed - which is annoying when I want to add something (like tornadoes, for instance).

I've taken a step back and simplified.  Mostly, by reducing the total amount of necessary data that I need to generate interesting tables.  In fact, I'm a little stunned by how little data I do need - and how this enables me to get more results by producing more groups of rolls.  A point I was trying to make with this post that got very little attention.

Next, I'm going to talk about what I've been doing the last two weeks, more or less getting on top of the problem and offering up its details now, at a time when I'm still looking for reasons why this new system fails.  I can't see that yet - but that doesn't mean a failure hasn't already occurred.


The Weather Problem Described

Do your players care if the weather is sunny?

In most worlds, this is a question players never have to consider.  If there are tables for the weather, they are very simple - a few possibilities based on a simple random die roll at best.  Chances are, the table hasn't been memorized by the DM, isn't consulted regularly and may come up only because of the druid's call lightning spell or some other detail that needs addressing.

That is because weather is ineffably hard to manage; there simply are no words.  Everything about weather is ridiculously chaotic and imprecise, while at the same time adhering to rigid principles of geography and physics.  Offering tables for weather is like trying to predict the position of one of two feral cats, fighting violently inside an iron cage, a minute from now.

The only possible solution is to simplify.  It needs to be understood, however, that the more a given system simplifies the weather, the less relevant it becomes.  That is why role-playing games do not include rules for weather - because any weather system that can be detailed in the space of two pages inside a book will be inherently useless where it comes to contributing to the player experience.

Anyone who has set out to make a weather system for their world discovers very quickly how much work it takes to lift that system to the point where it is relevant.  Be it known that it is a massive amount of work.  More than an ordinary DM, anywhere, wants to put into their campaign, just so the party can get wet once in a while.  For the amount of work it requires, even an elaborate weather system's value will defy the DM's persistence.

Yet I and others find ourselves fighting to get such a system built.  Why?

The most obvious reason is that weather is important in all our lives.  In a culture without technology, even a culture of fifty years ago, weather was even more important.  For a pre-modern culture, for a technology that existed four hundred years ago, weather was the greatest single factor in everyone's life.  There's no question about that.  All culture revolved around it.

For some of us, who want to reproduce the experience of living in a world where the elements are fundamental to the outlook of the inhabitants, weather remains the fatal flaw in the design.  Without it, the world is a fake, a sham, artificial . . . an inauthentic, cheesy swindle, like the moment in a film when it's realized the 'metal armor' worn by the actors is made of painted plastic.

It just won't do.

And we would solve it - except that a weather system is such a phenomenal frustration to build, we're literally forced to accept our impotence there.  It isn't just that we haven't got a weather system . . . it is that there seems no possible way to create one.

Those of us who try recognize the wall we're bashing our heads against.  The reality is, we're going to kill ourselves before that wall comes down.

Okay, so there's the motivation.  Let's pause for a moment and talk about what we'd like a weather table to do.

Well, temperature for a start.  Knowing the temperature would allow us to measure how the characters are dressed, how much water they will need to drink, whether the rivers or ponds they mean to cross are frozen over, how important a fire is, whether they're better off being in an inn instead of camping out, the practicality of armor in both very hot and very cold environments, etcetera.  There's a lot of character actions tied to temperature.

Next, knowing whether it is raining or not would be helpful.  Rain makes a big difference in travel and combat - as anyone knows who remembers when professional football had to contend with outdoor stadiums.  Rain increases hypothermia, makes life much more slippery and unpleasant, is a critical factor in whether rivers and streams can be crossed and in general speaks to many details about setting up camp, riding a horse, crossing through wilderness and the onset of disease.  What's more, comparing precipitation to temperature tells us whether we can expect a downpour or a blizzard.

Because it matters, the magnitude of the rain is also something we'd like to know.  Is it going to rain a lot?  Is the snow deep?  There's a wide gap between a few spattering raindrops and a deluge.  We need to know how much as well as if it rains.

Next comes wind.  Wind is where it gets tricky.  We can throw a dart at a board to get temperature; we can make rain/sunny a 50/50 proposition if we want and roll a d4 to know how much rain . . . but wind is a problem.  It isn't enough to simply roll a die to determine which direction the wind is coming from - if wind direction were fully random, how would ships travel from one side of the world to the other?  It isn't enough to roll a die to see how strong the wind is, because a complete calm will devastate ship travel while a little too much wind will destroy whole towns.  Making a wind chart means creating a bell curve of some kind . . . but when three or four random gales turn up in a month, pretty soon that bell gets taller and taller.  Whereupon, well, we get a situation where the wind is the same every day.

Moreover, so many of the other features we want out of wind are both important and hard to make universal.  We want a generation system for storms.  Rain doesn't always fall from a thundercloud, but we want to know when it does.  We want a generation system for specific types of storms: hurricanes, tornadoes, ice storms, hail storms, dust storms, sand storms, freezing rain, fog, mist and all the lesser versions of that list that produce a 'feel' for the weather without actually being the full-on manifestation.

Which brings up another order of magnitude for everything discussed so far: how long?  How long does the temperature last?  How long does the rain fall?  How long does the wind blow?  How long must the characters endure a thunderstorm, a sand storm, a fog?  Are the characters in the direct path of the hurricane, or are they on the fringe?  How close is the tornado?  When it occurs, are the characters even in danger?  Does the freezing rain fall all morning, or just for a minute or so?  Does the hail beat against the ground for a half a minute or does it hammer down for a quarter of an hour, creating a hail fog?

See, the real interesting thing about the weather are all the deviations that turn up.  Temperature, precipitation and wind are not enough; these things combine with the hydrography and topography of an area to produce these strange, fascinating spin-off results that can't be managed with a simple table, for two fundamental reasons:

  • Everywhere in the world is different, and thus requires a unique table.  Fogs turn up in my part of the world rarely.  They usually don't persist.  A table that will produce a 'fog' result that applies where I live would be useless for the Eastern Seaboard or the North Sea or the Bay of Bengal.  What's more, the difference between these places is quintessentially important to the pleasure of one part of the world having different weather than another part; so we are talking hundreds of tables to produce a meaningful variety.
  • Interconnectivity between different elements of the weather is hopelessly imprecise; so we know the temperature, the rainfall and the amount of wind - so what?  Who's to say that these three things, in the magnitude they presently have, will produce a specific, given result?  Does a wind shear always produce a tornado?  Do thunderclouds always produce rain?  Does lightning always strike at the ground?  Is a certain place on the coast always hit by a hurricane in the right season?
There's another consideration that I hesitate to bring up, since it isn't a problem my world has.  Just to put it out there, however, to emphasize the difficulties most worldbuilders have where weather is concerned:  what is the data for temperature and precipitation for a world like, say, Greyhawk?  Where are the hurricane tracks?  Where does 'tornado alley' occur, due to consistent wind shears due to masses of air between the pole and the subtropics?  Where do the doldrums start?  If we were going to map out sea currents, where would we put them?  For sea currents, as we know, are very important to places in the world like Alaska or Norway, places so far north that if it were not for the Japan Current and the Gulf Stream, they would be virtually uninhabitable.

I hope this starts to suggest the enormity of the problem.  If the reader truly wants to know the full scope of what could be realized, spend a few days with wikipedia, following every link on every page like the one I used to give 'types of fog.'  Start here.  Stay in the general subject of meteorology and diligently keep track of every phenomenon that could make a significant change to a normal, everyday event in your present campaign.

You'll run out of energy before you run out of phenomenon.