Moving on. The Selected table refers to selecting the data which determines prices for a market city. The City distances and the Source table totals are put together here to come up with the distribution for the desired market city.
The first tab, called 'Selection,' determines the shortest distance to market zones that have more than one market city. For example, you can see that the Archangel zone (zones listed across the top) has two markets in it, "Archangel" and "Sudborough." Now I must admit this table is a hang-over from before I discovered the MIN function in excel, and I haven't updated this since last year. Again, I will update it after working out the market city distances, which should be after Christmas.
In the meantime, if a given city - Astrakhan, say - is closer to Sudborough than to Archangel, than the Sudborough distance is used for determining distribution out of that zone. It's really pretty simple, so I'll move on.
The 'Market Provinces' tab, then, shows the distances that will be used. Take note that distances are shown on this table to Africa, America and so on - these are average distances to these places, which serves somewhat to smooth out the results for the present, until these areas are properly divided out. If a city is equi-distant to everything in China, then the distinctness is lost. There's nothing I can really do about this - until I can map China, it is either consider it all one portion, or discount it from the table altogether. Neither is very desireable. I could subdivide China now, but that's a lot of trouble and I suppose I feel I need to save work where I can.
Note also that Italy is still listed as a single unit on this table. The upgraded version will divide Italy ... and probably the Low Countries and India also, since I can get those separated and made ready for this table through December.
Very well. As an experiment, lets get ready to highlight a line and copy it. I'll highlight Astrakhan, line 5, so you can follow along with me. Don't highlight the whole line, just the numbers between column C and column ND. At present, that's 351 zones. There will be many more when the new zones are added.
Move to the next table, 'Input Distance.' Paste the data as a 'VALUE' ... but the only thing that will happen if you paste normally is that the highlighting will change.
You can look over this sheet but there is nothing you need do. You can see that the Sources table data has been copied here, and that the products are listed down the side. If you move to the 'Collect Index' tab, the distances that you have entered from Astrakhan have been divided into the Sources data, and that collected in a series of numbers running down column B next to the products in column A. If you've done it right, you should see a population of 2,152,088.1 and a Total References of 404.5.
At this point you will want to open the Prices Template table. On that table you will see that the first tab reads 'Input Data.' (ignore the gobbledy gook on the 'Jewellery' tab ... that's just leftover from when I was trying to solve this problem.
You will see on the Input Data table a similar list to the one on the Selected table. They line up perfectly, so all you need do is copy the data from the 'Collect Index' on the Selected (column B, lines 4 to 907) and paste them AS VALUES to the 'Input Data' page on the Prices Template. Get it lined up, or you'll have problems.
There you go, you have just created all the prices for everything for the market of Astrakhan. It takes less than 30 seconds to create a price list for any city - you just copy and paste twice. This is the goal for all the work I do otherwise.
A bit more here and then I'll move on to the Prices Table next. And that will be a long, long post (or possibly two or three).
You'll note two tabs marked 'Birth Process' and 'Sheet2.' This is a half-done effort I have put down for the time being that determines the birth location for a new character depending on what market zone the character is generated in (you've just learned how to change the data for a market zone). I've been sort of juggling the numbers, not being happy with them, so I've left off making this table properly. but you can see from 'Sheet2' a list of zones and what dominant race of humanoid controls that zone. Thus, it is unlikely that a human character will be from a zone where the population is made up of gnolls. You can wander through the other bits of tables there - it should be evident what I was trying to do. Eventually I'll get around to fixing all this and making it pretty, but for the time being it isn't a priority.
Monday, October 24, 2011

Sunday, October 23, 2011
Market Cities New Start Table
I was going to start the New Selected table, as I said, but I have to write about the Market Cities table a bit first. You will note that it says "New Start" ... that is because I'm keeping all the old data for a little while until I'm sure this new system works. It seems to, but one can never tell. When I feel confident, I'll change the title to Market Distances, a name that at the moment is being used by the old file.
Before going into it, you will probably have found that you are getting a 'circular reference' warning when you open the file. There's nothing wrong here - the file is fine. But you will have to go into your computer and tell it to stop resolving circular issues. I admit, I'm not sure this can be done on everyone's excel; I use Vista, which I am not sorry to say I love, however others feel about it. I can tell you how to fix the problem in Vista. In other formats you're on your own.
The way you do it is to open the Office Button and select Excel Options at the bottom of the pop-up. Once there, click on 'Formulas,' second from the top on the left. Then, on the top right of the pop-up for changing formula options, you'll see a button for 'Enable iterative calculation.' Click it. Then change the 100 in the box below to 1, and change the 0.001 to 0. There, you're all set. No more circular arguments.
However, be warned about randomly messing with this table. The formulas are interactively sensitive, so if you type the wrong thing on the page you'll get error messages which will cascade everywhere and ruin the data. At the moment, testing it, I can't seem to think of a way to make it do that (I removed formulas to make it more streamlined, so it might be immune now).
You'll note that if you hit the function key F9, the numbers will change. This is because there ARE circular functions, but they can't cascade back and forth and crash the files because the iteration has been set to 1. Each time you refresh, the numbers calculate. There's a lot of calculation here, so it can take a long time for them to stabilize. I made some changes last week so they haven't stabilized since that change ... but they will eventually. It usually takes about five or six minutes of hitting the button. This is much less time than the manual calculations I used to have to do. But recently my life got a whole lot easier, and I'm very happy about that.
This table is still in the process of being reformatted; that is why there are only about one fifth of the total cities included. I'll be getting the rest up in the next few weeks.
The lines in orange are the accurate distance between the cities, selecting the shortest route. The others are calculations, as the post I linked talks about. These numbers are used for the Selected table, so I needed to talk about them here.
If you want to mess with this and get the numbers to stabilize, do. Then change one distance, making it lower, and watch them restabilize. It's fun.
Someone who's a programmer could probably do this easier than on excel, but I asked for that two and a half years ago and got no comments back. There are times I hate programmers.
But the guys who invented excel deserve deification.
Before going into it, you will probably have found that you are getting a 'circular reference' warning when you open the file. There's nothing wrong here - the file is fine. But you will have to go into your computer and tell it to stop resolving circular issues. I admit, I'm not sure this can be done on everyone's excel; I use Vista, which I am not sorry to say I love, however others feel about it. I can tell you how to fix the problem in Vista. In other formats you're on your own.
The way you do it is to open the Office Button and select Excel Options at the bottom of the pop-up. Once there, click on 'Formulas,' second from the top on the left. Then, on the top right of the pop-up for changing formula options, you'll see a button for 'Enable iterative calculation.' Click it. Then change the 100 in the box below to 1, and change the 0.001 to 0. There, you're all set. No more circular arguments.
However, be warned about randomly messing with this table. The formulas are interactively sensitive, so if you type the wrong thing on the page you'll get error messages which will cascade everywhere and ruin the data. At the moment, testing it, I can't seem to think of a way to make it do that (I removed formulas to make it more streamlined, so it might be immune now).
You'll note that if you hit the function key F9, the numbers will change. This is because there ARE circular functions, but they can't cascade back and forth and crash the files because the iteration has been set to 1. Each time you refresh, the numbers calculate. There's a lot of calculation here, so it can take a long time for them to stabilize. I made some changes last week so they haven't stabilized since that change ... but they will eventually. It usually takes about five or six minutes of hitting the button. This is much less time than the manual calculations I used to have to do. But recently my life got a whole lot easier, and I'm very happy about that.
This table is still in the process of being reformatted; that is why there are only about one fifth of the total cities included. I'll be getting the rest up in the next few weeks.
The lines in orange are the accurate distance between the cities, selecting the shortest route. The others are calculations, as the post I linked talks about. These numbers are used for the Selected table, so I needed to talk about them here.
If you want to mess with this and get the numbers to stabilize, do. Then change one distance, making it lower, and watch them restabilize. It's fun.
Someone who's a programmer could probably do this easier than on excel, but I asked for that two and a half years ago and got no comments back. There are times I hate programmers.
But the guys who invented excel deserve deification.
Sources Table
Because of the size of this table, I used to have it chopped into parts ... but that has become inconvenient and now I just keep it in one piece. It's 21 megs, big for an excel file, so if your computer is slow you're going to have trouble with this one. What's really annoying is that it is all empty space. This format is easiest however for the whole thing, as it can be filtered and compared most easily.
Along the top are 954 possible products and services, and down the side are the various locations for references identified by the aforegoing Encyclopedia folder. Thus, if you scan down to lines 20 through 26, describing the Archangel "zone" (as I call it), and column AHW ("fish") you can see the Encyclopedia makes one reference to Onega Lake having fish, one reference to "Sudborough" having fish, and three references to the White Sea having fish.
Now, I'd better explain about the names you'll find here. There is no 'Sudborough' anywhere near Archangel that you'll find on a map or an encyclopedia. In mixing my world and the D&D world together, certain weird aspects get applied to names of some regions. Modern Archangelsk, for instance, in actual history was founded as Archangel in 1584 by English traders in a big empty land on the south shore of the White Sea. In my D&D world, Archangel was founded in 1584 by English traders who stumbled across a small area of winter halflings who had successfully retrenched a region surrounded by gnoll-infested forests. The English joined with the halflings and the region still battles off gnoll raiders. The city of 'Sudborough' is a halfling town which in the real, modern world is called "Onega." So where it says in the encylopedia that Onega produces fish, I write down on this Sources table that Sudborough produces fish.
There are quite a lot of examples of this. The first two zones, Croft and Khath under ALTSLOK, are four modern oblasts in 1952 Russia: East Kazakhstan (Croft), Gorno-Altay (Roth), Khakass (Khath) and Tuva (Tuvath). Because in the real world the human population was so low, I filled these regions up with dwarves, being that they are mostly the Altai-Tuva mountain ranges separating modern Siberia from Mongolia. Croftshelm, Rithdome, Rothering and Bokoth are towns. Moth Basin is a river valley in modern Khakass.
All of these equivalents are found on the Cities file, in mapmaking, if you want to look and compare. I'll be getting to a description of the Cities by and by.
For the moment, take note that the KINGDOMS are in capital letters, while the name of the trade zone is in bold, highlighted more darkly to distinguish it. Totals for the zone are gathered from the individual locations for references (thus the Archangel zone has 5 references for fish, 1 reference for cod and 2 references for herring). There is a column then for total fish (AJR, darker than the other fish columns), which shows Archangel as having 8 fish references.
So goes the whole table. Various groups of things are added together for later application in the system, such as grains, pulses, fruits, medicinal plants, woodcrafting, skins, meat and so on. This is done partly to compensate for having only a certain number of things for which I have adequate production figures, letting me estimate the base amount of said product or group of products being produced in 1650. There will be more about this, later.
Sorry, I'm jumping around a bit. Going back to the far left of the table, column D, 'TOTAL REF.', the subscriber can see there are totals for each location. It would be nice to think that these totals could be used to determine the economy of a specific locale, but this isn't so. The data simply isn't precise enough for that. It is good enough (because there is so much of it) for me to apply the later system of distances and availability to get a good set of trading tables ... but this source table is really completely unreliable as hard data. You can muck with it if you want and try to pound it into that, but I suspect you will be disappointed in the grand picture. Still, some places do produce a lot of different types of things, and some are much more heterogeneous in products, and something might be gleaned from that.
As you can see, there are a LOT of different places that sources come from. The sources listed here are in two forms. Those where the place names have been sorted out into 'zones,' and a second group where they haven't been. Starting on line 2768, you can see Africa is listed all as one big body (not including Egypt), along with America, China, East Indies, England, France, Greenland, India, Ireland, Japan, Portugal/Spain and Southeast Asia. These are places where I have gathered the references, so I know those totals, but I have yet to map these areas and thus distribute the sources into their market zones.
You'll note there are references for America and for the East Indies, but that I had said in the Encyclopedia post that I hadn't done those areas yet. Still, entries in the encyclopedia for European, African and other areas make a general reference here and there to the Americas (especially a long article about gemstones in the book), and those references were duly recorded here.
So what makes a 'zone'? To begin with, it must have a market city. Column F shows the number of encyclopedia references to a city being a 'port,' a 'trading centre,' a 'market' or a 'commercial' hub ... and these are all interpreted as 'market.' Search Hamburg and you'll find 15 references in the markets column. Bremen in turn came out a 14. London came in at 12, Barcelona and Lubeck managed 11 and both Shanghai and Constantinople amounted to 10. I didn't decide how many these places had ... this was the encyclopedia referring to their trading statuses over and over.
You can search out other places in the old world for their totals.
I drew the line at dividing up secondary territories into tinier and tinier zones, so some zones have more than one trading city in them - such as Cuxhaven and Hamburg both being in the Hamburg zone, or a region like Transylvania having six markets: Grosswarden, Hermannstadt, Klausenburg, Kronstadt, Neumarkt and Sathmar. Those are their 17th century German names. Klausenburg is modern Cluj, Kronstadt is modern Brasov and so on. I try to keep the 17th century name for use, but sometimes the actual name is the one shown on the table - I simply haven't gotten around to fixing it.
So, a zone is a secondary region with however many market cities there are, one that has at least one trading city (this is as much because I have stats for population for that region as anything else). What about a region without a market city? I then assign that region to a nearby market, one that seems most logical. Thus, at the very top in the zone of Croft, the region of Roth has no trading city, and is then assigned to Croft.
These zones are the outsource for the trading tables that determine the price of everything. The subscriber can see that the 'Totals' tab on the table shows only the totals for the various zones, and not the lesser locations within those zones. It also shows the total number of references for each product: 2,903 market references, 70 tin, 19 raisins, 24 tapestries and so on and on ... 14,879 references in total.
One thing, however, This table has been updated since it was used to create the next table, called NEW Selected, which I will be talking about soon. I like to refer to these things as 'incarnations.' The Incarnation of the pricing table is dependent on the latest updating of the Selected table, which is dependent upon the latest Incarnation of the Sources, Cities and Market Cities (distances) tables, which are in turn dependent upon work done before those tables can be updated.
Thus, if I record from the encyclopedia into the Sources table, and update it, we can assume that the pricing table is now out of date ... until the next time I fix the Selected table based on the new sources I've found. THEN I can update the prices table.
At the present, I've most recently added much of Africa and Spain to the sources table, but I have yet to upgrade the prices to accept them. This is typical ... I don't like to update every time there's a change, so I wait until there are a lot of new sources, and then work up through the tables to get them all up to date. Right now, I am thinking I might get the pricing table up to date sometime after Christmas. I'll have holiday time to really work in December.
Oh, I was going to say that you can see I've started to sort India into zones. This is because I'm nearly finished mapping India, and I was interested in seeing - initially - how it would go. I actually get a kick from this, wondering where the largest numbers of references will come down, even if it isn't hardcore economics data.
Along the top are 954 possible products and services, and down the side are the various locations for references identified by the aforegoing Encyclopedia folder. Thus, if you scan down to lines 20 through 26, describing the Archangel "zone" (as I call it), and column AHW ("fish") you can see the Encyclopedia makes one reference to Onega Lake having fish, one reference to "Sudborough" having fish, and three references to the White Sea having fish.
Now, I'd better explain about the names you'll find here. There is no 'Sudborough' anywhere near Archangel that you'll find on a map or an encyclopedia. In mixing my world and the D&D world together, certain weird aspects get applied to names of some regions. Modern Archangelsk, for instance, in actual history was founded as Archangel in 1584 by English traders in a big empty land on the south shore of the White Sea. In my D&D world, Archangel was founded in 1584 by English traders who stumbled across a small area of winter halflings who had successfully retrenched a region surrounded by gnoll-infested forests. The English joined with the halflings and the region still battles off gnoll raiders. The city of 'Sudborough' is a halfling town which in the real, modern world is called "Onega." So where it says in the encylopedia that Onega produces fish, I write down on this Sources table that Sudborough produces fish.
There are quite a lot of examples of this. The first two zones, Croft and Khath under ALTSLOK, are four modern oblasts in 1952 Russia: East Kazakhstan (Croft), Gorno-Altay (Roth), Khakass (Khath) and Tuva (Tuvath). Because in the real world the human population was so low, I filled these regions up with dwarves, being that they are mostly the Altai-Tuva mountain ranges separating modern Siberia from Mongolia. Croftshelm, Rithdome, Rothering and Bokoth are towns. Moth Basin is a river valley in modern Khakass.
All of these equivalents are found on the Cities file, in mapmaking, if you want to look and compare. I'll be getting to a description of the Cities by and by.
For the moment, take note that the KINGDOMS are in capital letters, while the name of the trade zone is in bold, highlighted more darkly to distinguish it. Totals for the zone are gathered from the individual locations for references (thus the Archangel zone has 5 references for fish, 1 reference for cod and 2 references for herring). There is a column then for total fish (AJR, darker than the other fish columns), which shows Archangel as having 8 fish references.
So goes the whole table. Various groups of things are added together for later application in the system, such as grains, pulses, fruits, medicinal plants, woodcrafting, skins, meat and so on. This is done partly to compensate for having only a certain number of things for which I have adequate production figures, letting me estimate the base amount of said product or group of products being produced in 1650. There will be more about this, later.
Sorry, I'm jumping around a bit. Going back to the far left of the table, column D, 'TOTAL REF.', the subscriber can see there are totals for each location. It would be nice to think that these totals could be used to determine the economy of a specific locale, but this isn't so. The data simply isn't precise enough for that. It is good enough (because there is so much of it) for me to apply the later system of distances and availability to get a good set of trading tables ... but this source table is really completely unreliable as hard data. You can muck with it if you want and try to pound it into that, but I suspect you will be disappointed in the grand picture. Still, some places do produce a lot of different types of things, and some are much more heterogeneous in products, and something might be gleaned from that.
As you can see, there are a LOT of different places that sources come from. The sources listed here are in two forms. Those where the place names have been sorted out into 'zones,' and a second group where they haven't been. Starting on line 2768, you can see Africa is listed all as one big body (not including Egypt), along with America, China, East Indies, England, France, Greenland, India, Ireland, Japan, Portugal/Spain and Southeast Asia. These are places where I have gathered the references, so I know those totals, but I have yet to map these areas and thus distribute the sources into their market zones.
You'll note there are references for America and for the East Indies, but that I had said in the Encyclopedia post that I hadn't done those areas yet. Still, entries in the encyclopedia for European, African and other areas make a general reference here and there to the Americas (especially a long article about gemstones in the book), and those references were duly recorded here.
So what makes a 'zone'? To begin with, it must have a market city. Column F shows the number of encyclopedia references to a city being a 'port,' a 'trading centre,' a 'market' or a 'commercial' hub ... and these are all interpreted as 'market.' Search Hamburg and you'll find 15 references in the markets column. Bremen in turn came out a 14. London came in at 12, Barcelona and Lubeck managed 11 and both Shanghai and Constantinople amounted to 10. I didn't decide how many these places had ... this was the encyclopedia referring to their trading statuses over and over.
You can search out other places in the old world for their totals.
I drew the line at dividing up secondary territories into tinier and tinier zones, so some zones have more than one trading city in them - such as Cuxhaven and Hamburg both being in the Hamburg zone, or a region like Transylvania having six markets: Grosswarden, Hermannstadt, Klausenburg, Kronstadt, Neumarkt and Sathmar. Those are their 17th century German names. Klausenburg is modern Cluj, Kronstadt is modern Brasov and so on. I try to keep the 17th century name for use, but sometimes the actual name is the one shown on the table - I simply haven't gotten around to fixing it.
So, a zone is a secondary region with however many market cities there are, one that has at least one trading city (this is as much because I have stats for population for that region as anything else). What about a region without a market city? I then assign that region to a nearby market, one that seems most logical. Thus, at the very top in the zone of Croft, the region of Roth has no trading city, and is then assigned to Croft.
These zones are the outsource for the trading tables that determine the price of everything. The subscriber can see that the 'Totals' tab on the table shows only the totals for the various zones, and not the lesser locations within those zones. It also shows the total number of references for each product: 2,903 market references, 70 tin, 19 raisins, 24 tapestries and so on and on ... 14,879 references in total.
One thing, however, This table has been updated since it was used to create the next table, called NEW Selected, which I will be talking about soon. I like to refer to these things as 'incarnations.' The Incarnation of the pricing table is dependent on the latest updating of the Selected table, which is dependent upon the latest Incarnation of the Sources, Cities and Market Cities (distances) tables, which are in turn dependent upon work done before those tables can be updated.
Thus, if I record from the encyclopedia into the Sources table, and update it, we can assume that the pricing table is now out of date ... until the next time I fix the Selected table based on the new sources I've found. THEN I can update the prices table.
At the present, I've most recently added much of Africa and Spain to the sources table, but I have yet to upgrade the prices to accept them. This is typical ... I don't like to update every time there's a change, so I wait until there are a lot of new sources, and then work up through the tables to get them all up to date. Right now, I am thinking I might get the pricing table up to date sometime after Christmas. I'll have holiday time to really work in December.
Oh, I was going to say that you can see I've started to sort India into zones. This is because I'm nearly finished mapping India, and I was interested in seeing - initially - how it would go. I actually get a kick from this, wondering where the largest numbers of references will come down, even if it isn't hardcore economics data.
Encyclopedia Folder
Might just as well start at the simplest, least interesting thing. Let me just say I had a bad copy of the folder up the first time - an older version. The newer version is now in the files, so be sure you're looking at what I uploaded later. You can tell because Ireland is in the completed files.
Having grown up with a particular encyclopedia my parents possessed, the date of which goes back to 1952, and having been familiar in my youth with all things geography in a really big way, I had long before stumbled across lists of products produced in certain areas at certain times. If you take a look in the 'Complete Entries' folder, and past that into 'Completed Regions' (there are no other regions at the moment, with completed describing what has been put into the sources table, which we'll get to next), you'll find a long list of the regions I've researched for 'references', as according to the system I described back here. This is merely the raw data for those references.
Back in the 1990's, when I started recording this information in order to be sure that it was complete, I did not have the internet. For earlier, failed incarnations of trade tables, going back to the late 80s, I'd just copied the material straight out of the encyclopedias ... but I was always losing pages and I couldn't easily check something that should have been in an area, so in '97 I started writing everything out, straight copying the material out of the encyclopedia. It made sense, because if I needed to search something other than trade, the data was digital.
This became less and less necessary as the net, and particularly wikipedia, got thorough and reliable. Finally I started just writing out the products themselves ... though most of the files have a few entries at the beginning when I was copying everything that was relative to 1650 (no later history copied).
Some of it is flotsam and jetsam, a note here or there of something that should have been copied on some other file, but is still a file of its own ('Alba Iulia' for instance). True to my word, I'm providing the rough data, so I'm not bothering to fancy up the material any more than I need it to be fancied. I have no real reason to waste time fixing the few bits here and there, I can search them all anyway and they can be just as they are.
You can see an example of me writing everything in the Russia files, and me writing just the products in the France files. It's been an ongoing project all this past 14 years now. When I haven't got anything else to do, I just work on more of this.
Going to the top of the 'Encyclopedia' folder, what's there are things I haven't copied out yet (in complete, anyway): Canada, America, the East Indies ... all short, partial files. The places to be researched - everywhere that has a geographical entry in the encyclopedia - can be found in the 'Working Index,' just a long list of names. Teal and some brown for Canada/United States, Pink for Latin America and Green for the East Indies and Oceania. There used to be lists like this for Asia, Europe and Africa, but those have been researched, item by item.
Having grown up with a particular encyclopedia my parents possessed, the date of which goes back to 1952, and having been familiar in my youth with all things geography in a really big way, I had long before stumbled across lists of products produced in certain areas at certain times. If you take a look in the 'Complete Entries' folder, and past that into 'Completed Regions' (there are no other regions at the moment, with completed describing what has been put into the sources table, which we'll get to next), you'll find a long list of the regions I've researched for 'references', as according to the system I described back here. This is merely the raw data for those references.
Back in the 1990's, when I started recording this information in order to be sure that it was complete, I did not have the internet. For earlier, failed incarnations of trade tables, going back to the late 80s, I'd just copied the material straight out of the encyclopedias ... but I was always losing pages and I couldn't easily check something that should have been in an area, so in '97 I started writing everything out, straight copying the material out of the encyclopedia. It made sense, because if I needed to search something other than trade, the data was digital.
This became less and less necessary as the net, and particularly wikipedia, got thorough and reliable. Finally I started just writing out the products themselves ... though most of the files have a few entries at the beginning when I was copying everything that was relative to 1650 (no later history copied).
Some of it is flotsam and jetsam, a note here or there of something that should have been copied on some other file, but is still a file of its own ('Alba Iulia' for instance). True to my word, I'm providing the rough data, so I'm not bothering to fancy up the material any more than I need it to be fancied. I have no real reason to waste time fixing the few bits here and there, I can search them all anyway and they can be just as they are.
You can see an example of me writing everything in the Russia files, and me writing just the products in the France files. It's been an ongoing project all this past 14 years now. When I haven't got anything else to do, I just work on more of this.
Going to the top of the 'Encyclopedia' folder, what's there are things I haven't copied out yet (in complete, anyway): Canada, America, the East Indies ... all short, partial files. The places to be researched - everywhere that has a geographical entry in the encyclopedia - can be found in the 'Working Index,' just a long list of names. Teal and some brown for Canada/United States, Pink for Latin America and Green for the East Indies and Oceania. There used to be lists like this for Asia, Europe and Africa, but those have been researched, item by item.
Subscriber's Introduction
This is general information for the subscribers who have come onboard with my proposal. You now have access to half a gig of materials which I've built and which have accumulated over the years. This does not represent everything that I've done, or everything that I plan to put forward, but for the time being its a lot to poke through. I'm going to be describing the tables in a series of posts that can be read here. If you have questions, please address them here so that I can build up a popular FAQ for the future. Obviously, if you have anything personal, you can still email me at alexiss1@telus.net ... but I'd be just as happy to answer general questions out in the open.
I'd like to say that virtually all of this material is in some state of flux, which me making changes on a non-regular basis. I tend to work at something until either I dry up on it and need a break for awhile, or until a moment of inspiration hits me on some other project and I go rushing off in that direction. I will try to outline what's missing, what's half done, and what I hope to do in the future ... and then as I update tables there should be some evidence of my working on those things.
Some of this material is dry, dull data that may not look very interesting. I've included it so that it can be seen how A becomes B and is turned into C ... like the showing the math work example I gave in a comment a couple of days ago. I've included my general information for both the maps and the trade tables; at present all the maps ... including many vegetation maps which are not online ... are up to date as of yesterday. I am nearly finished India. I only have the Bengal delta of the Ganges and Brahmaputra to do.
Dropbox seems to work excellently ... so WickedMurph, if you're out there somewhere, I'll give you a 20% discount on a subscription for being enormously helpful in this. It is appreciated.
I'm sure something else will occur to me, but right now I'm going to get started on table descriptions.
I'd like to say that virtually all of this material is in some state of flux, which me making changes on a non-regular basis. I tend to work at something until either I dry up on it and need a break for awhile, or until a moment of inspiration hits me on some other project and I go rushing off in that direction. I will try to outline what's missing, what's half done, and what I hope to do in the future ... and then as I update tables there should be some evidence of my working on those things.
Some of this material is dry, dull data that may not look very interesting. I've included it so that it can be seen how A becomes B and is turned into C ... like the showing the math work example I gave in a comment a couple of days ago. I've included my general information for both the maps and the trade tables; at present all the maps ... including many vegetation maps which are not online ... are up to date as of yesterday. I am nearly finished India. I only have the Bengal delta of the Ganges and Brahmaputra to do.
Dropbox seems to work excellently ... so WickedMurph, if you're out there somewhere, I'll give you a 20% discount on a subscription for being enormously helpful in this. It is appreciated.
I'm sure something else will occur to me, but right now I'm going to get started on table descriptions.
Friday, October 21, 2011
A Generated Weather Table
Yes, for a few days I'll probably harp on the proposal I've made this week ... but in the meantime I'm still working on the weather tables. I'm fairly happy at the moment with temperature, precipitation and wind speed ... I'll be wanting to work on wind direction, probably, and unusual events occurring during storms next.
At the moment, however, the below table is generated from inputing the average low, the average high and the number of days per month with precipitation. These are very easy statistics to gather, easy to create yourself for your own campaign, and easy to steal from a part of the world you're having your campaign occur. True, at the moment they are detailed for temperate and arctic weather conditions - deserts and tropical jungles will need changes to be made, based on Koppen's Climate Classification system ... but one thing at a time.
Here is the table, generated for weather in Cuxhaven, where my offline party is, for August. Observers will note that the party has already experienced those conditions shown for the 15th. I can generate the rest of this at a click, so these are probably NOT the conditions the party will experience when they actaully wake up on the 16th.
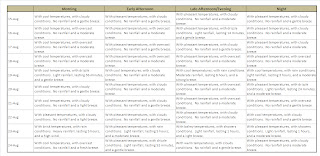
Rainfall times occur at some point during the period indicated, which can be divided into 6 hour periods for convenience - though not necessarily. A day's typical low occurs just before sun rise, and the high usually mid-afternoon, points in the day that are typically only 9 hours apart. But since those float, a DM is justified in working the details out as desired.
Obviously, this is only going to get more and more complicated the more features I add to it over time. And I should add that this table is meant to be fitted seamlessly with the wilderness damage effects table which I have spoken about from time to time. Development never ends.
At the moment, however, the below table is generated from inputing the average low, the average high and the number of days per month with precipitation. These are very easy statistics to gather, easy to create yourself for your own campaign, and easy to steal from a part of the world you're having your campaign occur. True, at the moment they are detailed for temperate and arctic weather conditions - deserts and tropical jungles will need changes to be made, based on Koppen's Climate Classification system ... but one thing at a time.
Here is the table, generated for weather in Cuxhaven, where my offline party is, for August. Observers will note that the party has already experienced those conditions shown for the 15th. I can generate the rest of this at a click, so these are probably NOT the conditions the party will experience when they actaully wake up on the 16th.

Rainfall times occur at some point during the period indicated, which can be divided into 6 hour periods for convenience - though not necessarily. A day's typical low occurs just before sun rise, and the high usually mid-afternoon, points in the day that are typically only 9 hours apart. But since those float, a DM is justified in working the details out as desired.
Obviously, this is only going to get more and more complicated the more features I add to it over time. And I should add that this table is meant to be fitted seamlessly with the wilderness damage effects table which I have spoken about from time to time. Development never ends.
Thursday, October 20, 2011
Putting It Right Out There
Seems to me that there is little reason to wait. If subscribers would like to jump on board with the offer made in the previous post, I will have time to start delivering material to you in some form this Sunday, October 23 - understanding that the data will be delivered in exactly the format and state that it exists at present on my computer. I'm not going to spend time cleaning up things, though I will post upon each file so that the subscriber can understand what they're looking at and how it is applied. I don't want to spend my life answering questions about how to use excel/publisher or how excel/publisher works, but I will explain how I've used it and what the various things are meant to accomplish and even how they might be altered by the subscriber for their own purpose.
Donations can be delivered to me using the "Donate" button on the right; please remember to calculate the surcharge for paypal. If you want to pay me by some other means, you'll have to contact me through alexiss1@telus.net and work that out with me.
For those who don't know, and who may or may not be having trust issues, my name is Alexis Smolensk. To the best of my knowledge most of the google references on the web do in fact refer to me, including my IMDb listing. I hope not to encourage any stalkers, but you never know.
I am offering a piece of me for sale. I am completely sincere. I do not believe that anyone who has an interest in granular game design will be disappointed.
Donations can be delivered to me using the "Donate" button on the right; please remember to calculate the surcharge for paypal. If you want to pay me by some other means, you'll have to contact me through alexiss1@telus.net and work that out with me.
For those who don't know, and who may or may not be having trust issues, my name is Alexis Smolensk. To the best of my knowledge most of the google references on the web do in fact refer to me, including my IMDb listing. I hope not to encourage any stalkers, but you never know.
I am offering a piece of me for sale. I am completely sincere. I do not believe that anyone who has an interest in granular game design will be disappointed.
Wednesday, October 19, 2011
With Greater Consideration Towards the Subscriber
So, here is the proposal:
1. You pay me $100.
2. For six months, I will send you whatever tables I am working on, plus whatever back tables necessary to understand what I'm working on now. This will include the present weather tables, the wilderness damage tables I will be working on, my character sheet table, my maps in Publisher format, and ALL my trade tables. I will send you anything that has been updated every two weeks as I move forward, and you will get access to any new idea or table I start in that time.
I'm quite serious.
The offer is restricted to people whom I can reasonably trust. It also depends on my getting a large enough response, so comment if you'd choke up the cash.
Tell me I'm crazy.
UPDATE:
In consideration, I see three principle problems. The first would be that the total collection of all this material represents hundreds of megabytes of information. Using email, this will take a great deal of trouble to send to subscribers. Not in the long run, where what I can create in a two-week period email would probably handle. But the initial dump of information is daunting.
I could use a central server to dump information on, which could then be retrieved; however, any server could then be hacked for the material, and so the need for security creates possibly more problems than it solves.
The second problem would be that I have not taken the time to write down how some of the material is used and applied. The trade system, for instance, requires several files which I know how to use to support the others ... this would have to be described and written about, probably on this blog, so that it could be implemented by subscribers. This is by no means impossible.
Finally, there is the matter of my contractual obligation. How does the subscriber know that I am sending 'everything.' Does 'everything' include material on my computer that is not D&D oriented? Does it include material I would consider resembles the copywritten text of published books, written out for my benefit but not suitable for distribution in exchange for money? This is a problem. I want the subscriber to feel he or she is getting his or her money's worth, but I don't want to feel 'owned' or compelled to break my own personal codes about privacy.
All I can say is that my wish is to send 'everything' that I have personally created that is as original to D&D as I can make it, and to send the material I am producing on a bi-weekly basis. So 'everything' does NOT include material that is not created by me, or material which is not related to Dungeons and Dragons. So the agreement must be one of mutual trust and regard; that the subscriber trusts me to be forthcoming, and that I trust the subscriber to keep the information and not distribute it flagrantly to others. In terms of business, the subscriber's hundred dollars is not a 'payment' but a 'donation,' and my returning material in kind is a 'donation' also.
I've sold many a subscription to magazines that had no more contractual obligations than that. I trust this will satisfy the readership.
1. You pay me $100.
2. For six months, I will send you whatever tables I am working on, plus whatever back tables necessary to understand what I'm working on now. This will include the present weather tables, the wilderness damage tables I will be working on, my character sheet table, my maps in Publisher format, and ALL my trade tables. I will send you anything that has been updated every two weeks as I move forward, and you will get access to any new idea or table I start in that time.
I'm quite serious.
The offer is restricted to people whom I can reasonably trust. It also depends on my getting a large enough response, so comment if you'd choke up the cash.
Tell me I'm crazy.
UPDATE:
In consideration, I see three principle problems. The first would be that the total collection of all this material represents hundreds of megabytes of information. Using email, this will take a great deal of trouble to send to subscribers. Not in the long run, where what I can create in a two-week period email would probably handle. But the initial dump of information is daunting.
I could use a central server to dump information on, which could then be retrieved; however, any server could then be hacked for the material, and so the need for security creates possibly more problems than it solves.
The second problem would be that I have not taken the time to write down how some of the material is used and applied. The trade system, for instance, requires several files which I know how to use to support the others ... this would have to be described and written about, probably on this blog, so that it could be implemented by subscribers. This is by no means impossible.
Finally, there is the matter of my contractual obligation. How does the subscriber know that I am sending 'everything.' Does 'everything' include material on my computer that is not D&D oriented? Does it include material I would consider resembles the copywritten text of published books, written out for my benefit but not suitable for distribution in exchange for money? This is a problem. I want the subscriber to feel he or she is getting his or her money's worth, but I don't want to feel 'owned' or compelled to break my own personal codes about privacy.
All I can say is that my wish is to send 'everything' that I have personally created that is as original to D&D as I can make it, and to send the material I am producing on a bi-weekly basis. So 'everything' does NOT include material that is not created by me, or material which is not related to Dungeons and Dragons. So the agreement must be one of mutual trust and regard; that the subscriber trusts me to be forthcoming, and that I trust the subscriber to keep the information and not distribute it flagrantly to others. In terms of business, the subscriber's hundred dollars is not a 'payment' but a 'donation,' and my returning material in kind is a 'donation' also.
I've sold many a subscription to magazines that had no more contractual obligations than that. I trust this will satisfy the readership.
Big Ego
While the readers of YDIS are taking bets on how long it will take before my head explodes and I crumble into a weeping pool of jelly locked up in an asylum somewhere; and while I am threatened with the destroying the livelihood of some people; and while I am chastised one more time for being a bad person with bad motives who needs to learn how not to be bad ... I have to tell you all, the internet is a funny, frustrating, wonderful place.
As much as I feel we will all soon be serfs forced to work by law for some company who will deny our right to quit, seek a better position or even advance from within, and as much as I feel the future holds the promise that things will get much, much worse than they already are, I am glad that I live in the time that I live in. I am glad for the proliferation of porn, for the opportunity to speak to large numbers of persons without the need for spending cash out of my pocket, the fingertip response to the obtaining of information on every possible subject, both approved and disapproved. I am glad for the opportunity to speak my mind and to have others, for good or ill, speak back their minds to me. This is a great time. This is more fun than the inventors of barrels and monkeys could have ever hoped to devise. It's a thrill to know that having my mind entertained for a lifetime requires no more than a chair, a computer and an internet connection ... mostly because my mind knew how to do it before the last of those things was invented.
And so a word for the sake of general information. I am an extraordinarily happy person. Yes, I know, I'm not the writer I still hope to be. I don't possess world domination. But when I am writing about something that matters to me, I'm happy. And when I am kicking the shit out of someone for pissing me off by saying something stupid, I'm happy. There is nothing worse in this world that stupid people saying stupid things and not being called on them. (This is why Jon Stewart ought to be given a personal channel in Canada, government funding and global distribution - so he can go on kicking the crap out of stupidity in the states and he wouldn't have to occasionally kow-tow to the people who pay his salary, something he has to do now and then, like fingernails on a blackboard).
If those persons who I have kicked and hurt find glee in writing blog posts about me and my insanity, my blindness or my obvious mental retardation, good for them. If, however, they feel that somehow said blogposts will affect my behavior in such a way as to hurt my ego, it might help if those posts were not written within hours of my writing something here. Oh yes, woe is me, my ego has been well and truly crushed, so many times, by such instant and - I have to say - predictable attention.
Sometimes I think I am providing a small cottage industry for bloggers who have run out of things to say about things that really matter, so that they can gain a few more followers and a little bounce on their blog hits - and thus their own egos - because I am there to hate.
Well, let us all lift our egos together in song. These are wonderful days, and they will not come again.
As much as I feel we will all soon be serfs forced to work by law for some company who will deny our right to quit, seek a better position or even advance from within, and as much as I feel the future holds the promise that things will get much, much worse than they already are, I am glad that I live in the time that I live in. I am glad for the proliferation of porn, for the opportunity to speak to large numbers of persons without the need for spending cash out of my pocket, the fingertip response to the obtaining of information on every possible subject, both approved and disapproved. I am glad for the opportunity to speak my mind and to have others, for good or ill, speak back their minds to me. This is a great time. This is more fun than the inventors of barrels and monkeys could have ever hoped to devise. It's a thrill to know that having my mind entertained for a lifetime requires no more than a chair, a computer and an internet connection ... mostly because my mind knew how to do it before the last of those things was invented.
And so a word for the sake of general information. I am an extraordinarily happy person. Yes, I know, I'm not the writer I still hope to be. I don't possess world domination. But when I am writing about something that matters to me, I'm happy. And when I am kicking the shit out of someone for pissing me off by saying something stupid, I'm happy. There is nothing worse in this world that stupid people saying stupid things and not being called on them. (This is why Jon Stewart ought to be given a personal channel in Canada, government funding and global distribution - so he can go on kicking the crap out of stupidity in the states and he wouldn't have to occasionally kow-tow to the people who pay his salary, something he has to do now and then, like fingernails on a blackboard).
If those persons who I have kicked and hurt find glee in writing blog posts about me and my insanity, my blindness or my obvious mental retardation, good for them. If, however, they feel that somehow said blogposts will affect my behavior in such a way as to hurt my ego, it might help if those posts were not written within hours of my writing something here. Oh yes, woe is me, my ego has been well and truly crushed, so many times, by such instant and - I have to say - predictable attention.
Sometimes I think I am providing a small cottage industry for bloggers who have run out of things to say about things that really matter, so that they can gain a few more followers and a little bounce on their blog hits - and thus their own egos - because I am there to hate.
Well, let us all lift our egos together in song. These are wonderful days, and they will not come again.
Not Simulation & Not Prediction; Just Presentation
It's not that I'm harping on this subject, it's only that I have a sustained attention span, and since weather is what I'm working on when I'm not posting, working, eating, sleeping, having sex and so on, I'm going to write a little bit more about weather. I know those gentle readers with ADHD will suffer a little, but brighten up - it looks to be a short post.
A number of people have suggested sources associated with modern, scientific weather prediction models and prognostic climate charts, etcetera, and while I appreciate the interest I have to tell you that anything associated with meteorological prediction models is of no use to me at all. I'd like to explain why.
The purpose of mathematical prediction of the weather as carried forth by scientific meteorologists is to produce a wide-scale model in order to gauge the effect upon a large number of people, or upon crop production, transport, communications and so on. If temperature goes up, how will that affect the creation of hurricanes, say, and how will that affect the eastern seaboard of North America? Can we expect a bad winter if there's increased sunspot activity? Whatever. In any event, like I said, it is of no use to me.
I am not attempting in any way to build a weather model that takes into account the weather for the whole coastal region of, say, Lower Saxony and Denmark, which surrounds the online party. The only thing I need to know is what is the weather like in the fifty foot circle surrounding the party. Beyond that, I don't care. Because of this, the weather chart I make has to be party-centric. I need to know if it is raining, or snowing, or hailing, or sunny. I don't need to know if there's a complicated storm front moving across the whole continent and how that is slamming against the low originating in the Norwegian Sea.
There might be something to be said for devastation caused by a particular storm ... but the facts are that parties in the 17th century move pretty slowly and over a small area in a given length of time, so if the party itself isn't actually devastated by the storm, I don't care if parts of Denmark are. I can assume they'll be fixed by the time the party gets there.
There is a tendency to overthink tables in general. My trade tables, for another example, are designed to do one thing: produce a price at the counter the party needs to pay. They do provide some information about the movement of goods and services in general, but this information - I have to say - gets a little wonky if you look at it too closely. If you try to apply the 'sources' of trade exactly as written, you will discover two towns of the same size right next to each vastly differing in production and services, and therefore real value ... which means the system breaks down if used to try to determine per capita income. I don't worry about that. The system wasn't designed to deliver that kind of information. It is designed to have an axe cost this much in this market, and that much in that market, and that is all. And in this function, it works marvelously.
A few days ago I made reference to the frontages movie studios made of towns for the camera to see when filming the actors walk along a street. For the purpose of the game, I don't need tables that looks behind the buildings any more than the camera does. This is game design, not abstract modelling for the real world, and it helps to remember the purpose of that design.
If you let yourself get bogged down in things that really don't matter, you'll never get anything you try to do done. Which won't matter anyway, because it won't serve a purpose your players will care about.
A number of people have suggested sources associated with modern, scientific weather prediction models and prognostic climate charts, etcetera, and while I appreciate the interest I have to tell you that anything associated with meteorological prediction models is of no use to me at all. I'd like to explain why.
The purpose of mathematical prediction of the weather as carried forth by scientific meteorologists is to produce a wide-scale model in order to gauge the effect upon a large number of people, or upon crop production, transport, communications and so on. If temperature goes up, how will that affect the creation of hurricanes, say, and how will that affect the eastern seaboard of North America? Can we expect a bad winter if there's increased sunspot activity? Whatever. In any event, like I said, it is of no use to me.
I am not attempting in any way to build a weather model that takes into account the weather for the whole coastal region of, say, Lower Saxony and Denmark, which surrounds the online party. The only thing I need to know is what is the weather like in the fifty foot circle surrounding the party. Beyond that, I don't care. Because of this, the weather chart I make has to be party-centric. I need to know if it is raining, or snowing, or hailing, or sunny. I don't need to know if there's a complicated storm front moving across the whole continent and how that is slamming against the low originating in the Norwegian Sea.
There might be something to be said for devastation caused by a particular storm ... but the facts are that parties in the 17th century move pretty slowly and over a small area in a given length of time, so if the party itself isn't actually devastated by the storm, I don't care if parts of Denmark are. I can assume they'll be fixed by the time the party gets there.
There is a tendency to overthink tables in general. My trade tables, for another example, are designed to do one thing: produce a price at the counter the party needs to pay. They do provide some information about the movement of goods and services in general, but this information - I have to say - gets a little wonky if you look at it too closely. If you try to apply the 'sources' of trade exactly as written, you will discover two towns of the same size right next to each vastly differing in production and services, and therefore real value ... which means the system breaks down if used to try to determine per capita income. I don't worry about that. The system wasn't designed to deliver that kind of information. It is designed to have an axe cost this much in this market, and that much in that market, and that is all. And in this function, it works marvelously.
A few days ago I made reference to the frontages movie studios made of towns for the camera to see when filming the actors walk along a street. For the purpose of the game, I don't need tables that looks behind the buildings any more than the camera does. This is game design, not abstract modelling for the real world, and it helps to remember the purpose of that design.
If you let yourself get bogged down in things that really don't matter, you'll never get anything you try to do done. Which won't matter anyway, because it won't serve a purpose your players will care about.
Tuesday, October 18, 2011
Avoiding DTER
If you want to create a more elaborate table, the first thing you must dispense with is the flat, linear construction of "die total equals result." You see the table everywhere: roll a d6; 1 = bugbears, 2 = goblins, 3 = orcs ... and so on. And then, when you have completed the die roll, and the encounter, you go back to the same die roll to produce another encounter. And after you've played using a table like this for a long time, you get sick of tables and go looking for some other aspect of D&D in which to get interested.
Now I want the gentle reader to recognize that even a board game, the thing that most D&D players decry as the evil thing that D&D has superseded, is more complex that what the DTER (die-total-equals-result) methodology offers. Let us consider, because it is familiar, the game of Monopoly.
Let's postulate the car, the thimble and the iron sitting upon the GO square. Two dice are rolled for each. The car gets a four and a five and moves to Connecticut Avenue and buys it. The thimble gets a two and a three and moves to Reading Railroad and buys it. The iron rolls two threes, landing on Oriental Avenue - buying it - and then rolls again, getting a five and a two and ending up on States Avenue - which the iron also buys.
When the next turn starts, the pieces do not move back to the beginning and start again. No, they proceed from the point where they are at and new results occur. Each turn is a stepping stone towards the next turn; each previous turn creates a formula that changes the position of the pieces for the rest of the game ... and in this formula a multiplicity of games results that are unpredictable and therefore consistently interesting to people. Monopoly is still played as a game for this reason.
However, the DTER method does NOT provide this. When you roll the die that determines that you throw orcs at the party, DTER tables do NOT then provide a stepping stone for the next roll. The next roll occurs completely separate from the previous roll and for that reason the table is absolutely and completely useless for the construction of a sandbox world.
What would be the alternative? Well, to describe that, allow me to propose another example, also from the familiar file. Consider the game twister.
Here we have an extremely simple catalyst. We have four fundamental body parts: your left and right hands, and your left and right feet. And we have four colors: blue, yellow, red and green. When the arrow is spun, determining this particular body part must be applied to that particular color, we have 16 possibilities. This does not seem like very many ... but the game transcends the possibility in favor of something more important: the building up of result upon result. It isn't just that you put your left hand on the yellow circle, it is that then something will need to be done with your right hand, and then your right foot, and so on, while other people are also attempting to contort their bodies likewise.
If you are going to design tables for D&D you must think at least along the lines of Monopoly and Twister. How does this result lead to the next result? How does the combination of these results ultimately create new and unique sequences or troubles that are, at present, unexpected or unfamiliar?
In making a weather table, for instance, if I randomly produce a likelihood for high humidity; and I randomly produce a temperature; and I randomly produce the occurrence of a warm front or a cold front ... then how does the combination of these things produce OTHER results, such as fog, violent storms, high winds, a beautiful dry sunny day, and so on and so forth. To simplify it, if I roll three d6, they give me 16 possible results, balanced on a bell curve. But if I roll three d6, and the specific results of each of the three dice affect the result of the other two, then I produce 216 possible results. To make that more clear, if I designate the first die to be a type of vessel, and the second die to be a given weather result, and the third die to be a tactic for avoiding the oncoming vessel, then the combination of all three becomes a necessary interpretation of how A affects B which is in turn affected by C ... and not just designated possibilities. Do you see? The results are logical possibilties, given the perameters of the model you construct. If A lands at Connecticut, and B lands on Reading, and C lands on States, we have a model to guess at who is the most likely person to successfully obtain the Electric Company.
And if the next die 6 I add to this mix does NOT reset the game back at GO, I have 1,296 results to interpret. And the next die produces 7,776 results that can be interpreted.
Finally, if we then understand that the individual constructions which produce the interpreted results can then be balanced to fit a given circumstance, so that 3d6 can be used to determine the type of vessel, and a number of different dice and results can be used to determine the weather, and player choice can determine the tactic, we have an untallied number of results ... with possibilities worthy of making the game forever interesting.
No, obviously, it isn't easy. But the payoff is greater than crappy DTER tables can offer.
Now I want the gentle reader to recognize that even a board game, the thing that most D&D players decry as the evil thing that D&D has superseded, is more complex that what the DTER (die-total-equals-result) methodology offers. Let us consider, because it is familiar, the game of Monopoly.
Let's postulate the car, the thimble and the iron sitting upon the GO square. Two dice are rolled for each. The car gets a four and a five and moves to Connecticut Avenue and buys it. The thimble gets a two and a three and moves to Reading Railroad and buys it. The iron rolls two threes, landing on Oriental Avenue - buying it - and then rolls again, getting a five and a two and ending up on States Avenue - which the iron also buys.
When the next turn starts, the pieces do not move back to the beginning and start again. No, they proceed from the point where they are at and new results occur. Each turn is a stepping stone towards the next turn; each previous turn creates a formula that changes the position of the pieces for the rest of the game ... and in this formula a multiplicity of games results that are unpredictable and therefore consistently interesting to people. Monopoly is still played as a game for this reason.
However, the DTER method does NOT provide this. When you roll the die that determines that you throw orcs at the party, DTER tables do NOT then provide a stepping stone for the next roll. The next roll occurs completely separate from the previous roll and for that reason the table is absolutely and completely useless for the construction of a sandbox world.
What would be the alternative? Well, to describe that, allow me to propose another example, also from the familiar file. Consider the game twister.
Here we have an extremely simple catalyst. We have four fundamental body parts: your left and right hands, and your left and right feet. And we have four colors: blue, yellow, red and green. When the arrow is spun, determining this particular body part must be applied to that particular color, we have 16 possibilities. This does not seem like very many ... but the game transcends the possibility in favor of something more important: the building up of result upon result. It isn't just that you put your left hand on the yellow circle, it is that then something will need to be done with your right hand, and then your right foot, and so on, while other people are also attempting to contort their bodies likewise.
If you are going to design tables for D&D you must think at least along the lines of Monopoly and Twister. How does this result lead to the next result? How does the combination of these results ultimately create new and unique sequences or troubles that are, at present, unexpected or unfamiliar?
In making a weather table, for instance, if I randomly produce a likelihood for high humidity; and I randomly produce a temperature; and I randomly produce the occurrence of a warm front or a cold front ... then how does the combination of these things produce OTHER results, such as fog, violent storms, high winds, a beautiful dry sunny day, and so on and so forth. To simplify it, if I roll three d6, they give me 16 possible results, balanced on a bell curve. But if I roll three d6, and the specific results of each of the three dice affect the result of the other two, then I produce 216 possible results. To make that more clear, if I designate the first die to be a type of vessel, and the second die to be a given weather result, and the third die to be a tactic for avoiding the oncoming vessel, then the combination of all three becomes a necessary interpretation of how A affects B which is in turn affected by C ... and not just designated possibilities. Do you see? The results are logical possibilties, given the perameters of the model you construct. If A lands at Connecticut, and B lands on Reading, and C lands on States, we have a model to guess at who is the most likely person to successfully obtain the Electric Company.
And if the next die 6 I add to this mix does NOT reset the game back at GO, I have 1,296 results to interpret. And the next die produces 7,776 results that can be interpreted.
Finally, if we then understand that the individual constructions which produce the interpreted results can then be balanced to fit a given circumstance, so that 3d6 can be used to determine the type of vessel, and a number of different dice and results can be used to determine the weather, and player choice can determine the tactic, we have an untallied number of results ... with possibilities worthy of making the game forever interesting.
No, obviously, it isn't easy. But the payoff is greater than crappy DTER tables can offer.
Friday, October 14, 2011
The Sandbox Magician
I hear it expressed fairly often that the principle reasons for a sandbox campaign being difficult to run is the vast number of possibilities that present themselves, which the DM cannot possibly account for, or present. It is generally perceived, for instance, that if the party is on a particular street, that every building on that street must have a ready-made account of who lives there, how they fit into the campaign, what adventure hook they offer and so on and so forth ... BEFORE the party makes a choice about what to do. When blowing this up to a world-wide scale, it makes it look like a sandbox is insanely impossible.
A sandbox is nothing of the sort.
It help to think of old movie lots where most of the buildings were cleverly designed facings, which had no actual contents behind them. The windows might appear to have wares, people might come out through the doors or lean against the frontages, but it was all camera angles and carefully concealed falsehoods. Building half frames is much cheaper and saves a lot of time.
In a movie, obviously, we know the actors aren't going into the bank or the general store, so they can be designed solely for how they will appear on camera as the lead walks by. The question arises, how do we know the players in a campaign won't do otherwise?
Perhaps it is giving away too much of a secret, but the principles lie in the same presentation as that offered by an illusionist or other form of magician. You raise the left hand, you wave the hell out of it, you draw the player's attentions to what you going to do with the left hand, and then you hit them with the trick. You don't let them walk into the bank because something really, really interesting happens on the street that draws their attention.
There are a couple of reasons this works. To begin with, chances are the players are not invested emotionally by the prospect of walking into a bank just to see what is there. Chances are, the players in your half-made town are only kind of wandering around seeing what there is to see, and as such are not terribly certain that the bank is going to be all that interesting anyway. If something interesting happens on the street, the player is likely to think, better the interesting thing I can see, than the maybe-probably-boring not-definitely-interesting thing I can't see. And in any case, whatever might be in the bank can wait. Right now, this terrible accident/fight/mud-throwing or pie-throwing contest happening in the street right now seems to be something they really ought to catch while its ON.
The magician knows the audience will be looking at the stage, because the stage is where stuff happens. He or she can count on the audience not excessively looking about them at the ceiling, or the drapery, or the other people ... and just in case they feel compelled to do so, the lights are brought down to focus attention on the stage. When you are running a sandbox, you have to learn to do the same thing. Yes, the whole street IS available for examination, but most players really just want something of interest to occur that will take up their attention for the moment.
Another thing the magician knows is the audience's habits. Knowing how people will respond to certain stimuli is of HUGE importance in running as a DM. Reading a few texts of psychology, or expanding your knowledge of human behavior, and testing that knowledge, will do more to improve your dungeon mastering than a hundred half-thought-out treatises describing being a better DM. Human beings are in fact very predictable. Magicians and other sales-pitch artists KNOW this. You can, with a little talent and patience, learn to make people jump and change their minds by feeding them exactly the right information ... and D&D is tailor-made for inventing information designed to misdirect or correctly direct your players. The hand waving can get immensely enticing, and if you wave that sucker just right, you can get your players to fall for it every time. Why? Because they WANT to fall for it. Falling for it is FUN. That's what magicians know. Audiences are willing, happy, cheerful dupes who want to be duped. It's what they pay for.
Of course there's the cynic in the audience trying to figure out how its done. And your players will usually include at least one cynic who raises an eyebrow every time a cart falls over, or an NPC staggers in the door bleeding from a wound, or a child stumbled through the scene calling for its mother. A cynic only does this because he or she believes they have seen it all, and that they can 'guess' at what's coming next. So the sniff and snort at the pie-throwing in the street and stomp into the bank anyway.
What's really funny about this behavior is that it, too, can be predicted. Once you know the player is a cynic, and once he or she has made it clear that they WON'T be fooled, you can lay the trap for them again and again, only with a little more subtle handwaving than before. A very good magician knows that the cynic in the audience is intensely looking for anything that looks out of place in the scene ... and so all the magician has to do it hang a second very subtle oddity on some part of their person, to draw the cynic's attention. "Hah!" says the cynic, "It isn't the hand, it's the piece of metal on their hat! Look at it! Can't you see it?" And then the cynic spends the next three weeks trying to figure out how that metal was absolutely necessary to making the trick work. When of course it wasn't. At all.
Really. Penn & Teller are absolute masters at this sort of thing. They usually have four or five fake elements in view, to screw with your damn head.
As a DM, you're probably not going to be Penn & Teller, but you will do very well to have something in the bank that is also 'interesting' and attention-drawing, which could easily be in the tavern, or the inn, or in a back alley, or anywhere at all in fact that the cynic insists on going anyway.
It isn't necessary to have a different something in each possible pathway - its only necessary to have something that can fit in ANY possible pathway ... that can be there to lead the player forward into some inviegled idea of your own making, which the player will cheerfully pursue because it sounds interesting.
The problem with railroading doesn't come up because you haven't got something that fits into every box ... the problem with railroading happens when you, the DM, haven't got a second trick up your sleeve - and you push and push the players to watch the one trick you have to show. A good magician should be full of tricks - and if the audience doesn't like this one, there should always be one more up the sleeve that can be slipped out while the hand is waving.
A sandbox is nothing of the sort.
It help to think of old movie lots where most of the buildings were cleverly designed facings, which had no actual contents behind them. The windows might appear to have wares, people might come out through the doors or lean against the frontages, but it was all camera angles and carefully concealed falsehoods. Building half frames is much cheaper and saves a lot of time.
In a movie, obviously, we know the actors aren't going into the bank or the general store, so they can be designed solely for how they will appear on camera as the lead walks by. The question arises, how do we know the players in a campaign won't do otherwise?
Perhaps it is giving away too much of a secret, but the principles lie in the same presentation as that offered by an illusionist or other form of magician. You raise the left hand, you wave the hell out of it, you draw the player's attentions to what you going to do with the left hand, and then you hit them with the trick. You don't let them walk into the bank because something really, really interesting happens on the street that draws their attention.
There are a couple of reasons this works. To begin with, chances are the players are not invested emotionally by the prospect of walking into a bank just to see what is there. Chances are, the players in your half-made town are only kind of wandering around seeing what there is to see, and as such are not terribly certain that the bank is going to be all that interesting anyway. If something interesting happens on the street, the player is likely to think, better the interesting thing I can see, than the maybe-probably-boring not-definitely-interesting thing I can't see. And in any case, whatever might be in the bank can wait. Right now, this terrible accident/fight/mud-throwing or pie-throwing contest happening in the street right now seems to be something they really ought to catch while its ON.
The magician knows the audience will be looking at the stage, because the stage is where stuff happens. He or she can count on the audience not excessively looking about them at the ceiling, or the drapery, or the other people ... and just in case they feel compelled to do so, the lights are brought down to focus attention on the stage. When you are running a sandbox, you have to learn to do the same thing. Yes, the whole street IS available for examination, but most players really just want something of interest to occur that will take up their attention for the moment.
Another thing the magician knows is the audience's habits. Knowing how people will respond to certain stimuli is of HUGE importance in running as a DM. Reading a few texts of psychology, or expanding your knowledge of human behavior, and testing that knowledge, will do more to improve your dungeon mastering than a hundred half-thought-out treatises describing being a better DM. Human beings are in fact very predictable. Magicians and other sales-pitch artists KNOW this. You can, with a little talent and patience, learn to make people jump and change their minds by feeding them exactly the right information ... and D&D is tailor-made for inventing information designed to misdirect or correctly direct your players. The hand waving can get immensely enticing, and if you wave that sucker just right, you can get your players to fall for it every time. Why? Because they WANT to fall for it. Falling for it is FUN. That's what magicians know. Audiences are willing, happy, cheerful dupes who want to be duped. It's what they pay for.
Of course there's the cynic in the audience trying to figure out how its done. And your players will usually include at least one cynic who raises an eyebrow every time a cart falls over, or an NPC staggers in the door bleeding from a wound, or a child stumbled through the scene calling for its mother. A cynic only does this because he or she believes they have seen it all, and that they can 'guess' at what's coming next. So the sniff and snort at the pie-throwing in the street and stomp into the bank anyway.
What's really funny about this behavior is that it, too, can be predicted. Once you know the player is a cynic, and once he or she has made it clear that they WON'T be fooled, you can lay the trap for them again and again, only with a little more subtle handwaving than before. A very good magician knows that the cynic in the audience is intensely looking for anything that looks out of place in the scene ... and so all the magician has to do it hang a second very subtle oddity on some part of their person, to draw the cynic's attention. "Hah!" says the cynic, "It isn't the hand, it's the piece of metal on their hat! Look at it! Can't you see it?" And then the cynic spends the next three weeks trying to figure out how that metal was absolutely necessary to making the trick work. When of course it wasn't. At all.
Really. Penn & Teller are absolute masters at this sort of thing. They usually have four or five fake elements in view, to screw with your damn head.
As a DM, you're probably not going to be Penn & Teller, but you will do very well to have something in the bank that is also 'interesting' and attention-drawing, which could easily be in the tavern, or the inn, or in a back alley, or anywhere at all in fact that the cynic insists on going anyway.
It isn't necessary to have a different something in each possible pathway - its only necessary to have something that can fit in ANY possible pathway ... that can be there to lead the player forward into some inviegled idea of your own making, which the player will cheerfully pursue because it sounds interesting.
The problem with railroading doesn't come up because you haven't got something that fits into every box ... the problem with railroading happens when you, the DM, haven't got a second trick up your sleeve - and you push and push the players to watch the one trick you have to show. A good magician should be full of tricks - and if the audience doesn't like this one, there should always be one more up the sleeve that can be slipped out while the hand is waving.
Subscribe to:
Posts (Atom)