Yes, for a few days I'll probably harp on the proposal I've made this week ... but in the meantime I'm still working on the weather tables. I'm fairly happy at the moment with temperature, precipitation and wind speed ... I'll be wanting to work on wind direction, probably, and unusual events occurring during storms next.
At the moment, however, the below table is generated from inputing the average low, the average high and the number of days per month with precipitation. These are very easy statistics to gather, easy to create yourself for your own campaign, and easy to steal from a part of the world you're having your campaign occur. True, at the moment they are detailed for temperate and arctic weather conditions - deserts and tropical jungles will need changes to be made, based on Koppen's Climate Classification system ... but one thing at a time.
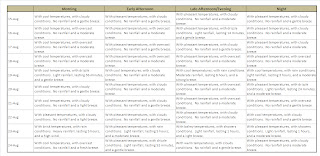
Here is the table, generated for weather in Cuxhaven, where my offline party is, for August. Observers will note that the party has already experienced those conditions shown for the 15th. I can generate the rest of this at a click, so these are probably NOT the conditions the party will experience when they actaully wake up on the 16th.
Rainfall times occur at some point during the period indicated, which can be divided into 6 hour periods for convenience - though not necessarily. A day's typical low occurs just before sun rise, and the high usually mid-afternoon, points in the day that are typically only 9 hours apart. But since those float, a DM is justified in working the details out as desired.
Obviously, this is only going to get more and more complicated the more features I add to it over time. And I should add that this table is meant to be fitted seamlessly with the wilderness damage effects table which I have spoken about from time to time. Development never ends.

No comments:
Post a Comment